
Even though BacktestXL is a robust and industry-grade backtesting framework for Ms. Excel, it is quite easy to start backtesting complex trading strategies. This section provides a broad overview that will help most users get started.
Table of Contents
Backtesting a Simple Trading Strategy
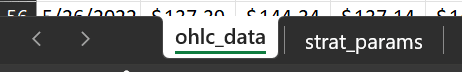
To run a backtest, we will require an Excel workbook with two worksheets:
- A sheet containing the data: it has to hold OHLC data. Additionally, you can add any number of columns with additional technical indicators.
- A sheet containing the parameters: this sheet will contain the logic behind the strategy.
Creating the Data Sheet
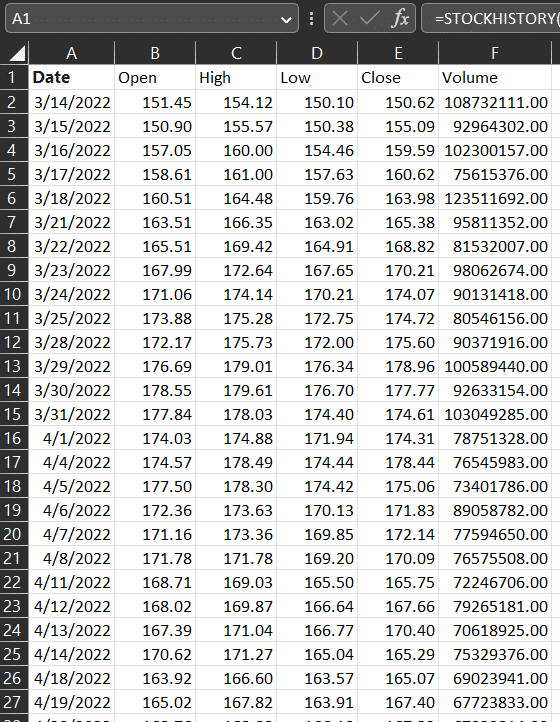
Let’s start with the sheet containing the data, which we will call “ohlc_data” in this case. It can contain an arbitrary number of columns but does require the following data: “Date“, “Open“, “High“, “Low“, “Close“. Investors might be interested in adding technical indicators, such as simple moving averages, Bollinger Bands, RSI, etc.
It is also possible to use other data sources. You could, for example, trade the SPY based on signals created by the VIX.
For simplicity, we will be using the STOCKHISTORY function from Excel to get a year’s worth of daily prices of Apple (AAPL).
In cell A1, paste the following formula:
=STOCKHISTORY("AAPL",TODAY()-365,TODAY(),0,1,0,2,3,4,1,5)The result should look as follows:
Creating the parameters Sheet
Now that we have the data we will be using for our backtest, we need to define the rules for buying and selling, amongst other parameters.
Let’s start by defining all of the parameters and explaining each one:
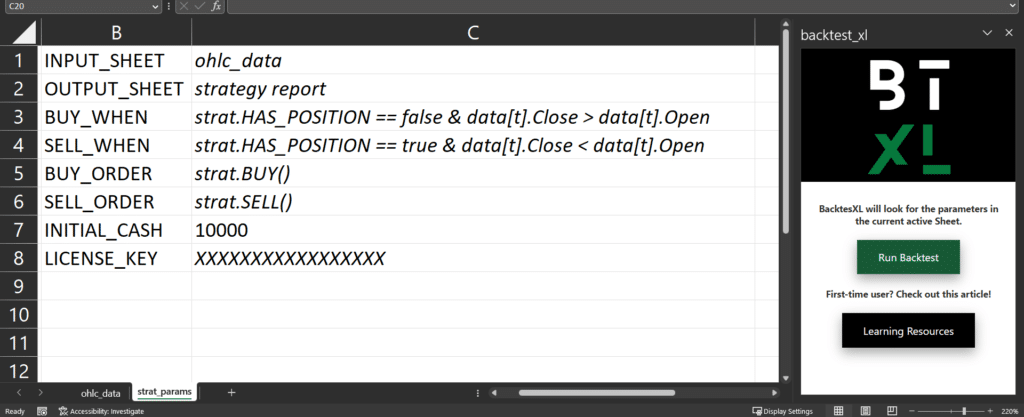
BacktestXL will look for the parameter names within the active worksheet. Whenever it finds a parameter name, BacktestXL will assume that the value is defined on the cell immediately to the right.
- INPUT_SHEET: indicates where BacktestXL should look for the data it will use for backtesting. This is a required field.
- OUTPUT_SHEET: the name of the Sheet that will be created for the report. Optional field. If no value is specified, it will default to creating a sheet called “report”.
- BUY_WHEN: specifies the condition that has to be met for buying the asset. In this example, it will buy if and only if we do NOT currently hold a position and if the current close price is greater than the current open.
- SELL_WHEN: specifies the condition to be met for selling the asset. In this example, it will sell if and only if we DO currently hold the asset and the current closing price is lower than the current open.
- BUY_ORDER: the type of buy order to be created when the conditions of BUY_WHEN are met. In this case, we buy as many shares as our current cash holdings allow via market orders. Optional parameter. If no value is specified, it defaults to this behavior (buying as many shares as possible via market orders). BacktestXL allows for much more complex order types.
- SELL_WHEN: the type of sell order to be created when the conditions of SELL_WHEN are met. In this case, we sell as many shares as we currently hold. Optional parameter. If no value is provided, it defaults to this behavior (selling all our current holdings via market orders). BacktestXL allows for much more complex order types.
- INITIAL_CASH: as the name suggests, it defines the initial cash holdings available for trading. If no value is specified, it defaults to 10,000
- LICENSE_KEY: If a valid license key is provided, BacktestXL will create the full report. Optional parameter. If no (or invalid) value is provided, BacktestXL will output the free version report.
Running the Backtest
Once we have specified the parameters of the backtest, we have to click the green “Run Backtest” button. If all required parameters are properly declared, BacktestXL will run the backtest and output the results to a new sheet with the name specified in the OUTPUT_SHEET parameter.
Your report will look similar to the following image:
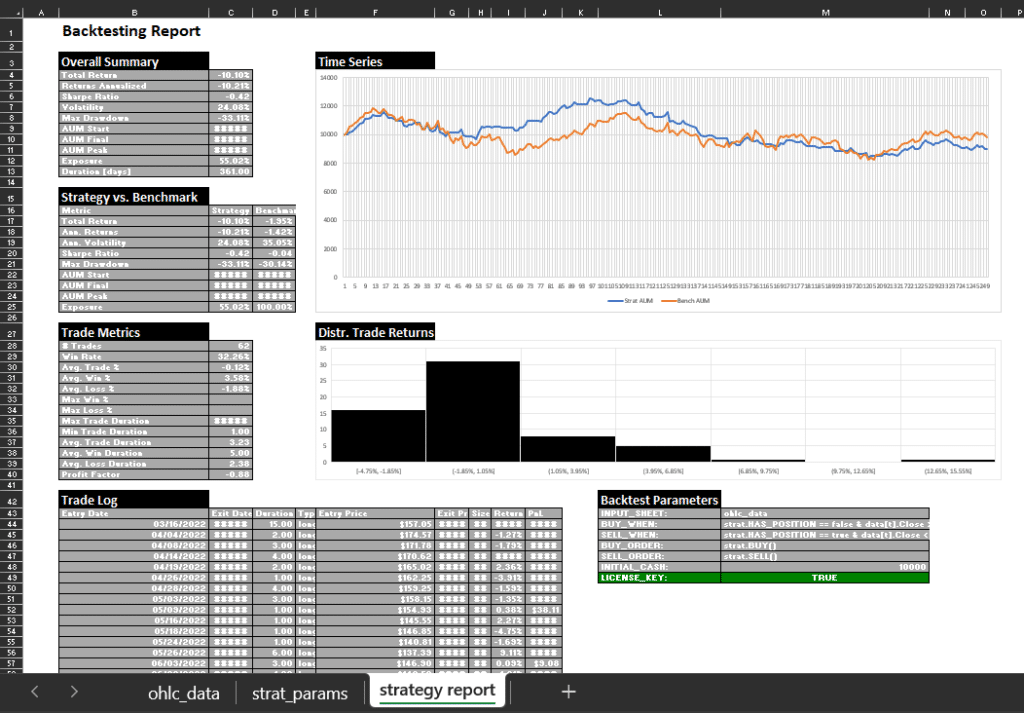
As can be seen, the output has a lot of data, so let’s break it down into its main components:
- Overall Summary: This table contains the most commonly used metrics to describe a trading strategy’s performance. Metrics: Total Return, Returns Annualized, Sharpe Ratio, Volatility, Max Drawdown, AUM Start, AUM Final, AUM Peak, Exposure, Duration [days].
- Strategy vs. Benchmark: This table compares the results of our strategy with a simple buy-and-hold strategy of the same asset. Metrics: Total Return, Ann. Returns, Ann. Volatility, Sharpe Ratio, Max Drawdown, AUM Start, AUM Final, AUM Peak, Exposure.
- Trade Metrics: This table analyzes the strategies’ trades in great detail. Metrics: Trades [#], Win Rate, Avg. Trade [%], Avg. Win [%,] Avg. Loss [%], Max Win [%], Max Loss [%], Max. Trade Duration, Min. Trade Duration, Avg. Trade Duration, Avg. Win Duration, Avg. Loss Duration, Profit Factor.
- Distribution of Trade Returns: This histogram displays the frequency of returns of the trades.
- Trade Log: This table provides useful information regarding all the trades created by the strategy. Metrics: Entry Date, Exit Date, Duration, Type, Entry Price, Exit Price, Size, Return %, PnL.
- Backtest Parameters: replicates the parameters set in the parameters sheet. Useful for keeping track of multiple reports.
No responses yet