
Trading is no longer a career practiced only by financial professionals. This can be attributed to a number of factors, such as the fact that trading was not as digitalized as it is today. For example, a retail investor in the United States would hardly have had access to European markets at the beginning of the 21st century.
Also, access to information was limited. Traders relied heavily on newspapers that did not provide up-to-date information, and financial television networks such as Bloomberg and CNBC were not available to most.
Fortunately, tools have been developed to help traders worldwide access the global financial market. Today, anyone can invest ridiculously small sums from their smartphone. A person from Zimbabwe, Argentina, Germany, or Hungary can participate in the global financial market, and one of the key factors that have contributed to this is the availability of information, the digitization of access, and the innovations of the fintech industry.
In this article, we will look at the best websites that every trader should know about. Some of the recommended websites are completely free, while others are only on a limited basis. However, this article only covers websites accessible to retail investors.
Table of Contents
Best Websites for Traders and Retail Investors
Finviz
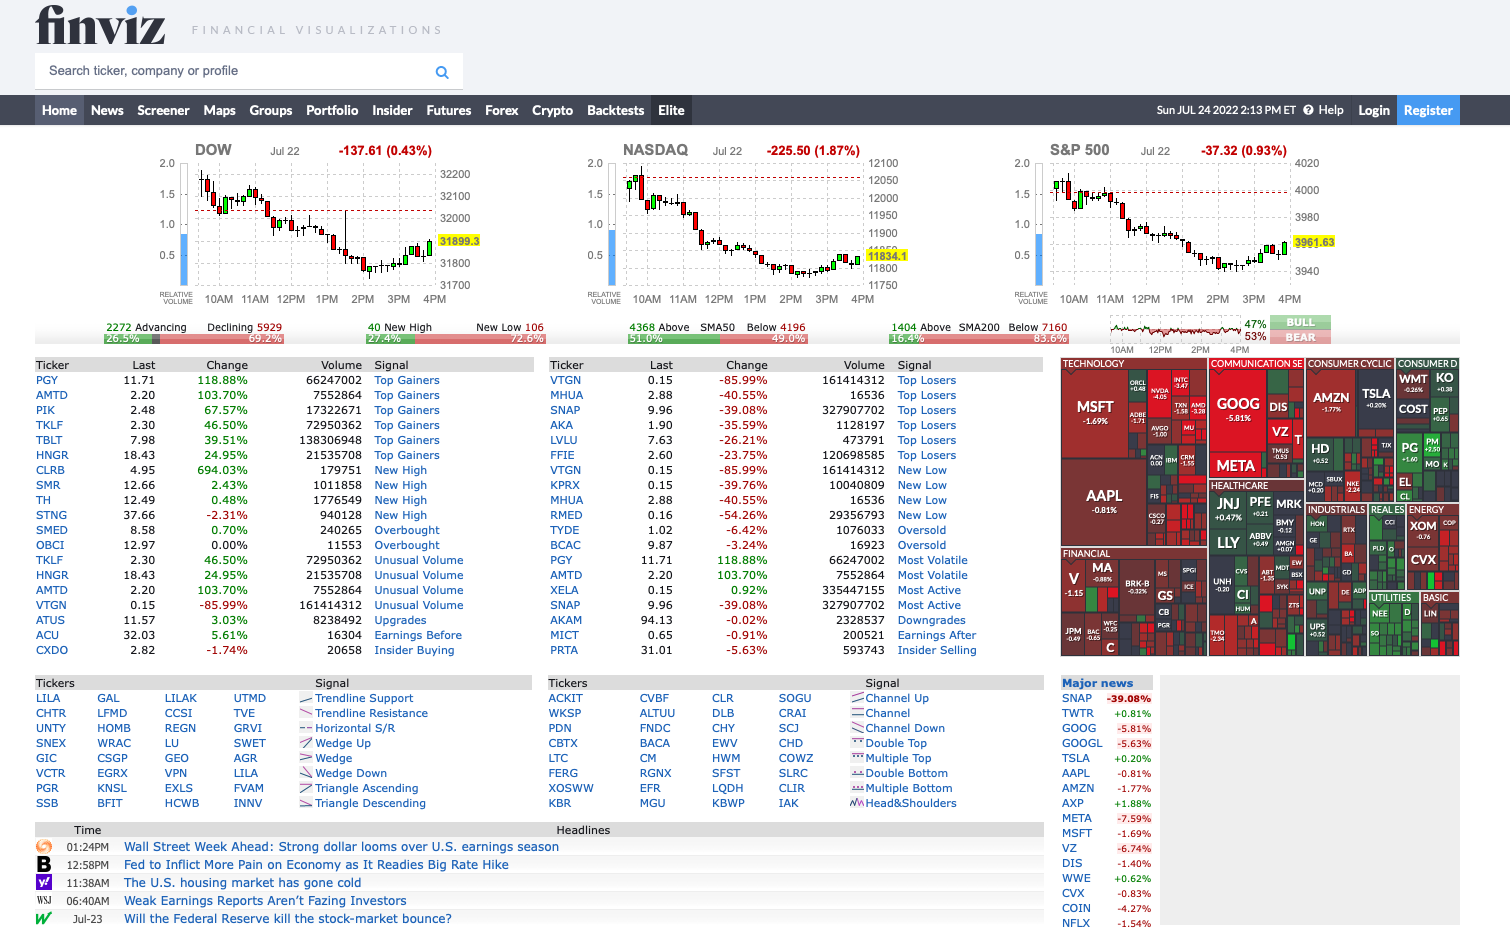
Finviz is probably one of the best stock screeners out there. And although the screening aspect is its main functionality, it has lots of additional modules. Finviz allows us to have a broad view of the stock market, we can access the main stock market indexes such as the DOW, NASDAQ, and S&P 500 along with their respective charts, which are updated every ten minutes.
By inserting the ticker in the search box, you can notice how complete this website is.
For example, when typing the Apple Inc. ticker ($AAPL), the first thing it shows us is a technical chart in daily periodicity.
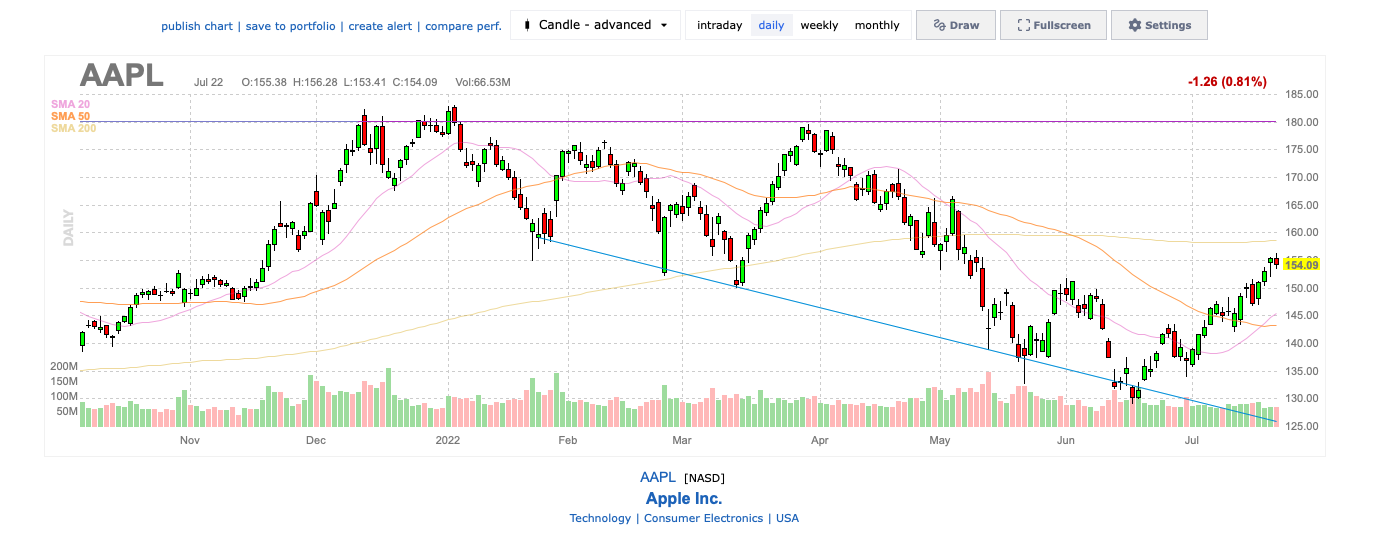
There are also several key ratios available just below the chart, such as Price/Earnings, Dividends, and various performance figures.
Finviz’s screener is an advanced tool that allows you us track and filter stocks based on several criteria, which can be categorized as follows:
- Descriptive: stock market, market capitalization, price range, etc.
- Fundamental: such as P/E, EPS growth, debt ratio, net profit margin, etc.)
- Technical indicators: chart patterns, candlesticks, RSI levels, etc.
It is undoubtedly a very useful tool both for those looking for intraday trading or those looking for long-term investment opportunities.
The heat map is another of the very good functions that this website has. It shows which stocks move in which direction (red = down, green = up) and market importance (area size). You can select maps for S&P500, World Stock, Industry (Technology, Financials, Consumer, etc.), and ETF.
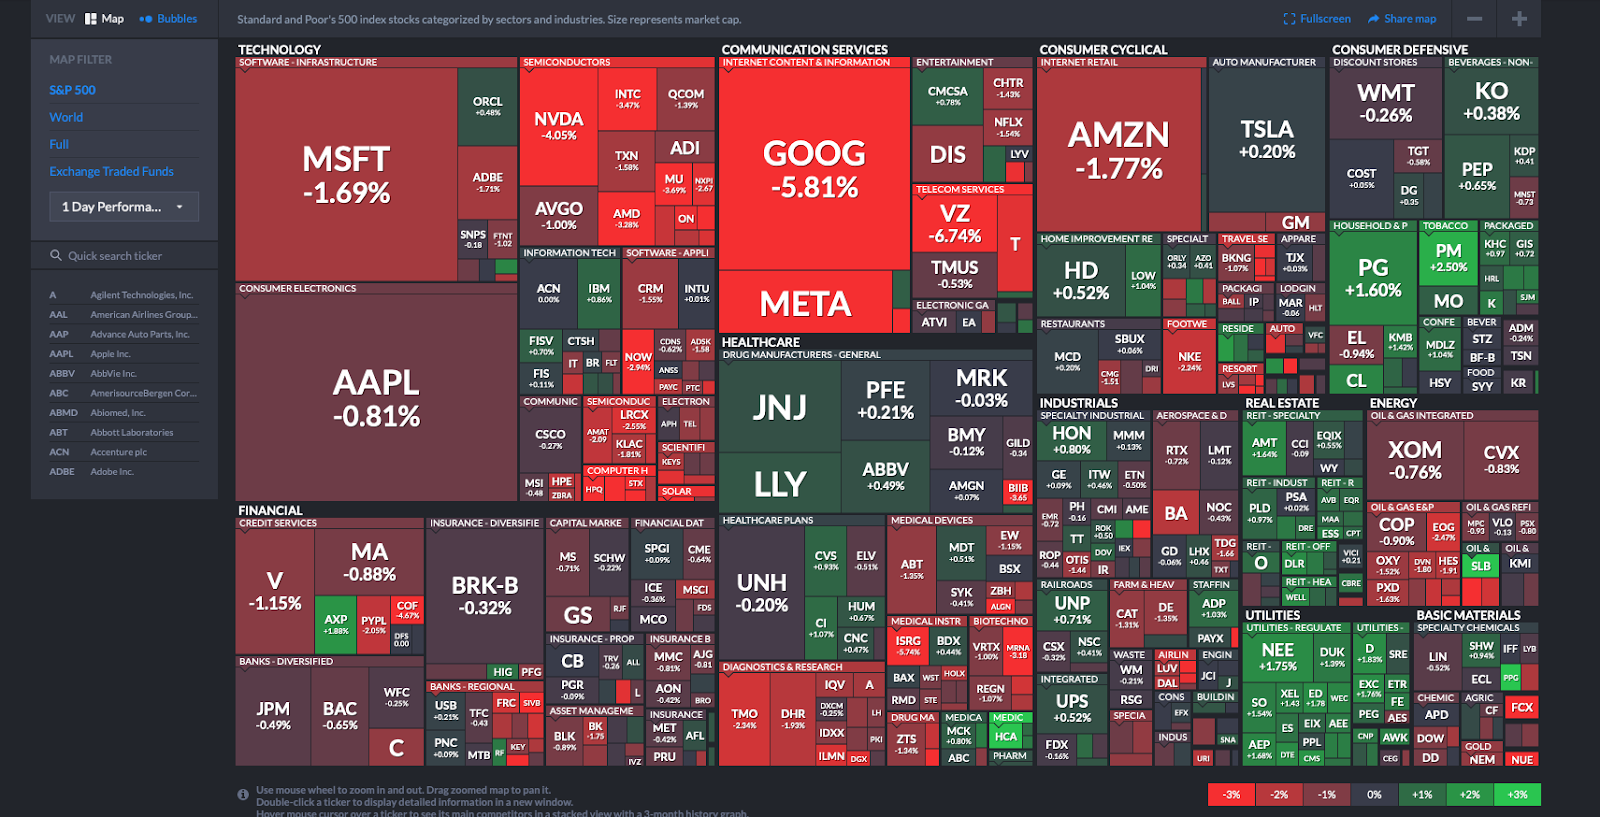
Subscribing to a paid plan gives access to data in real-time, access to eight years of the financial history of companies, and to receive emails with purchases from insiders, for example. If you operate intraday and would like to unify everything on a single web platform, where you have the screener, charting features, and technical indicators, it is undoubtedly a good tool.
On the other hand, if you only use the screener, the free version will probably suffice.
TradingView
Tradingview is perhaps the most widely used charting platform and the most complete as well. It is a graphical tool where we can analyze stocks, cryptocurrencies, forex, indices, and even economic metrics.
Without a doubt, during the 2020 pandemic, many people became interested in financial markets, which made more people aware of this platform and chose to use it for its ease of use.
Selecting the ticker of the asset you want to analyze will open the chart with various tools and indicators for technical analysis.
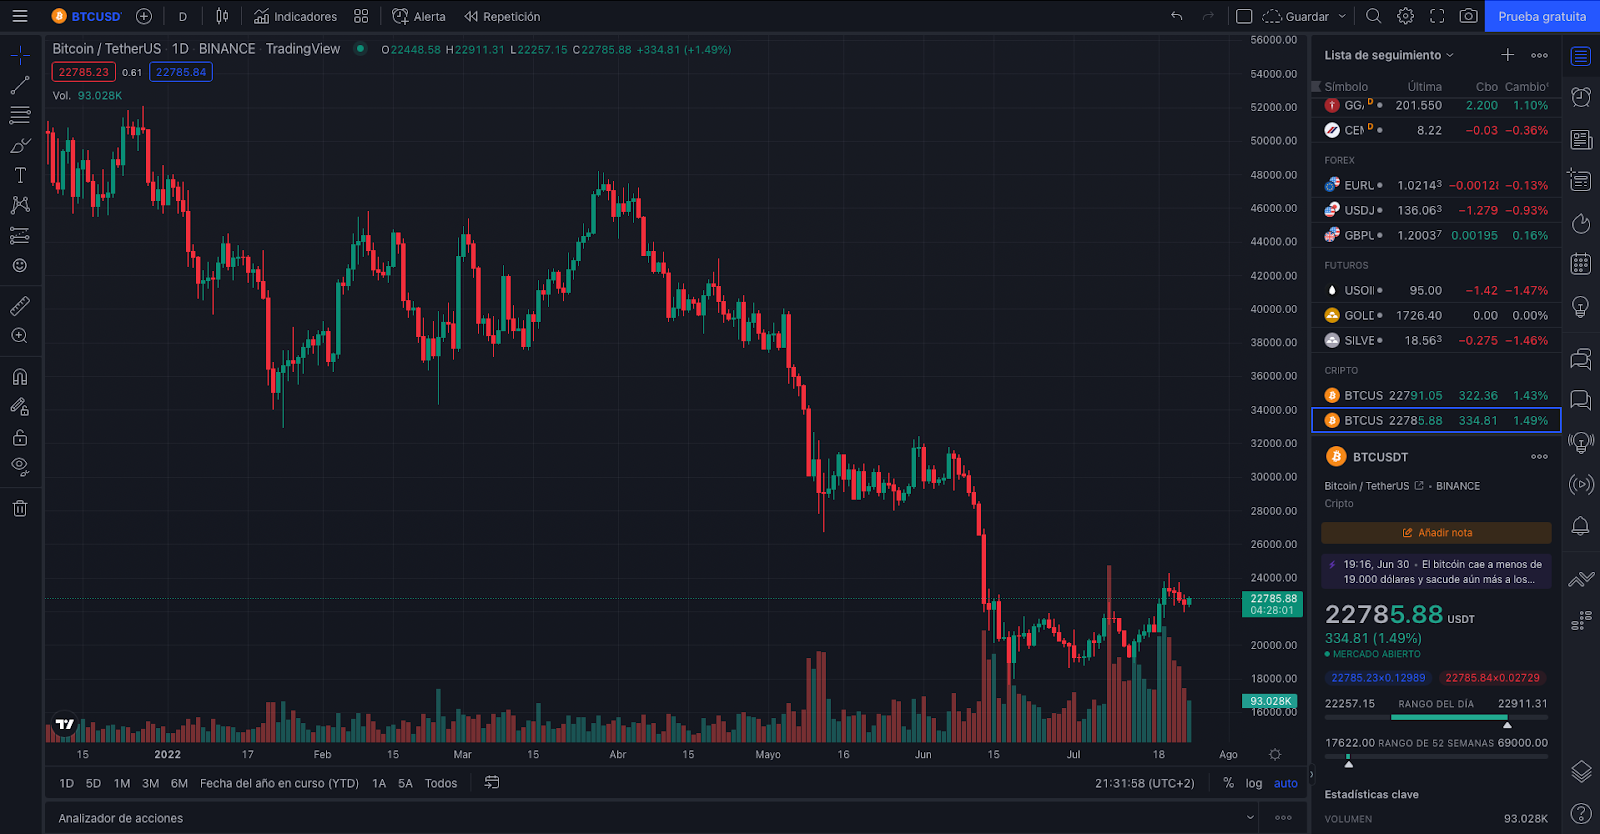
In the upper part of the graph, you will find the name or acronym of the selected asset, and the periodicity, which can be in a monthly, weekly, daily, and even 1-minute timeframe. Moreover, custom periodicities that are not in that list can only be accessed by paying the subscription.
You will be able to choose the type of graph (candles, line graph, bars, etc.), and the indicators. The interesting thing about Tradingview is the number of indicators it has, both free and paid, and the number of community-created indicators that you will be able to access. It is without a doubt one of the main advantages that this graphic tool has over the others.
On the right side of the chart, you can access the asset watchlist you have put together or the default one from Tradingview, as well as alerts, news, chats, insights, etc. And at the bottom, there is the stock screener and the strategy tester. This is a very useful tool for backtesting. Also, there is the possibility of being able to create your own indicator.
However, not everything is positive. Being able to access the charts will require a good internet connection. An unstable connection will cause you not to be able to visualize the graphs and indicators well.
Access to real-time data from certain markets also implies that you pay a subscription. Also, the free version only allows three indicators simultaneously, so if you use Volume, MACD and RSI, it will be enough, but if you want to add an additional indicator, you will have to remove one or pay a subscription.
Now, let’s see whether you should or not pay for a subscription. It is certainly a very useful tool if you venture into the financial world. Access to chart analysis and fundamental business tools makes it very useful in your day-to-day life. Using the free application for those who do analysis with longer timeframes, such as daily or even monthly, using only three indicators simultaneously at most, could be enough. Now, if your intention is to trade intraday, or swing trade with various indicators, it is worth paying for the subscription that best suits your budget and needs. It’s not cheap, but it’s a very useful tool.
TraderVue
TraderVue allows you to record trades online, which helps to analyze the performance of each one and improve your performance. It also has a social section, where multiple traders can share ideas and receive feedback. This helps build good habits, such as discipline, backtesting, and practice.
TraderVue is a very useful tool for traders to register and learn to improve their performance. If you are an intraday trader, this tool is going to be very useful and allow you to track your trades more clearly, in addition to helping you identify errors and improve your backtesting pipeline.
Users have the opportunity to analyze their performance with the aim of improving their operations. The general reports allow traders to have an overview of their daily and cumulative P&L, volume and profit percentage.
With risk analysis, traders can analyze their performance based on risk multiples, and the report will give you a better understanding of your risk-adjusted performance.
Paying the monthly subscription will be useful for those who are really trading the market on a daily basis. For traders who swing trade or who do not practice day trading, the free or basic version will suffice.
Choosing between the two paid plans will depend on your trading style, needs, and budget. If you are a retail trader, who operates intraday and you want to monitor and improve aspects of the operation, the lowest plan will reach you.
American Association of Individual Investors
Education is essential if you are interested in the financial world. And one of the main participants is the American Association of Individual Investors. The AAII is a nonprofit investor education organization which offers a financial newsletter with several reports and a portfolio model for subscribers of the annual membership.
The AAII offers:
- Model Portfolios
- Financial Newsletter
- Reports
- Investment Blog
- Dividend Investment Portfolio
- Stock Screeners
- ETF Screeners
It is a very complete website, where there are classes for investors, model portfolios, and a huge amount of interesting articles to read. In other words, it is an all-in-one website.
It is not only complete because of the facilities it offers investors but also because of the amount of free information it presents. The Markets section details the main movements of the market of the current date, the top gainers, top losers, and those companies that reached their minimum of one year; amongst other relevant metrics. It is, without a doubt, a free tool that every investor should have on their favorites.
Now, paying the annual subscription will depend on the need to access various reports and recommendations. If you are an active investor, the free information on the page is enough. Both for education and for keeping track of your favorite stocks.
If you are interested in receiving additional information or having a personalized screener, it is not a bad idea to pay the subscription. And the best of all is that you will have everything on a single website.
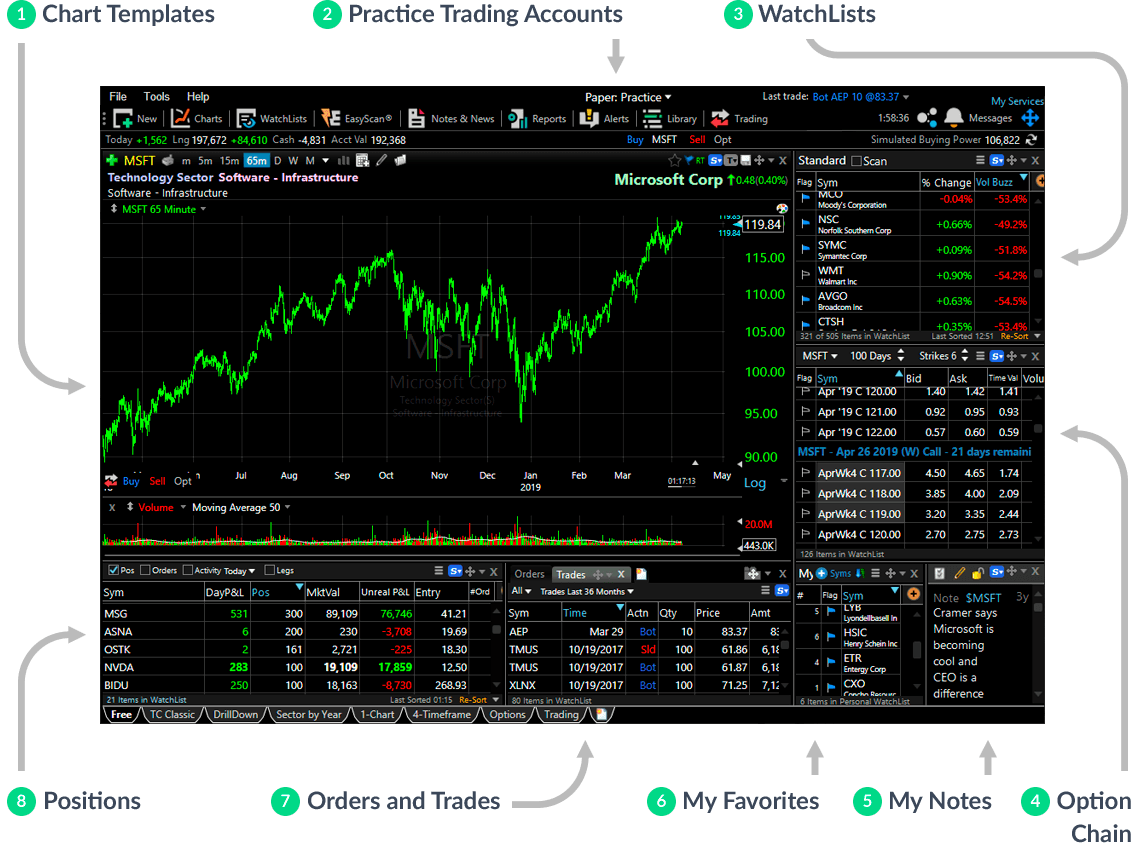
TC2000
Within the segment of tools geared towards charting, TC2000 stands out. Like Tradingview, it has a screener, indicators, and chart analysis tools. And as a last novelty, it allows you to carry out operations directly through them.
The platform is available for Mac and Windows, in addition to also having a mobile version.
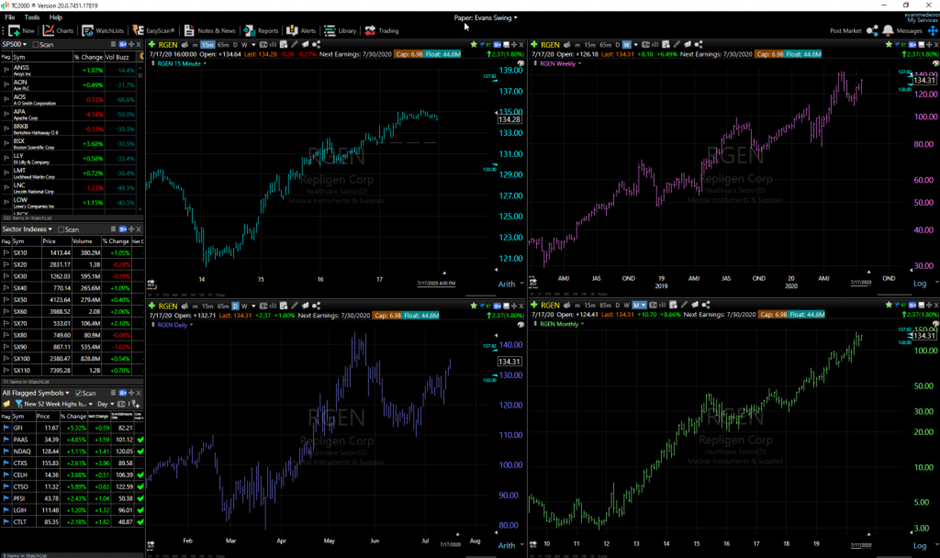
TC2000 charts are highly customizable and easy to use. First of all, the graphics are super clean. If you actively trade stocks, you already know how important clean charts are in day trading. While, at a glance, the charts appear similar to many other charting platforms, TC2000’s charts project a more professional look.
The software has auto-saving features, meaning that when you start it at the start of the day, it will initially load the same graphics from the day before. This can help Day Traders a lot to keep the updated chart of the assets they trade.
TC2000 also allows you to make notes and save them. This can be used to keep track of your Trading Journal easily.
In addition to the traditional functions that the rest of the platforms also have, the software can trade options. TC2000 also features an outstanding implementation of options trading and integration, where you can scan and filter a large number of options strategies and then execute and follow them directly from the charts.
Each platform has some kind of Watchlist where you can add stocks and keep track of companies and ETFs that matter to you. What makes TC2000’s WatchLists powerful is the actual columns that you can choose to track.
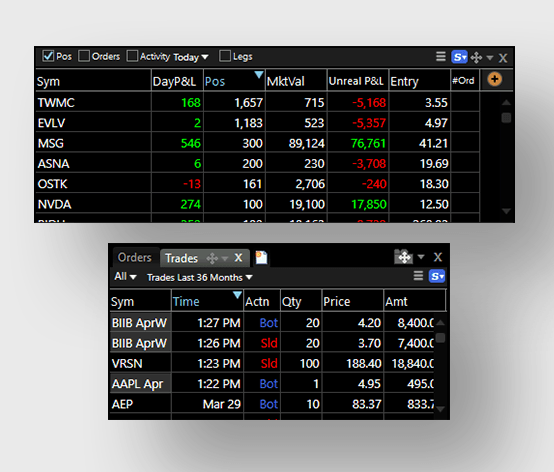
There are standard column headings like Performance, Volume, Indicator Values, etc. Another interesting feature of the software is that it allows you to add formulas to use as indicators, or perhaps, as alarms.
TC2000 has an excellent range of technical indicators and drawing tools; all the big ones are there, from OBV, RSI, and Bollinger Bands to Fibonacci and Andrews Pitchfork. It has more than 240 indicators.
But not everything is positive with this tool. If you want to backtest a strategy, then TC2000 is not a good alternative. You may be able to purchase an additional product (StockFinder) if you have a subscription, but you will need to call to request it. And not only that, if you trade cryptocurrencies or forex, it will not be useful since the application does not have those assets.
So, Tradingview or TC2000? If you only trade stocks and/or options, and want to take your setup to a more professional level, TC2000 would be a good alternative. Of course, taking into account the cost of the subscription.
Without a doubt, if you trade cryptocurrencies, stocks, or forex, Tradingview will give you allow you to do so. If you are only interested in performing analysis and don’t give much importance to options data, the simplicity (and costs) of Tradingview makes it a better alternative for your operation. On the other hand, if you do have demanding needs for a more rigorous set of tools, in addition to having access to option chain data, then TC2000 is definitely the way to go.
SheetsFinance
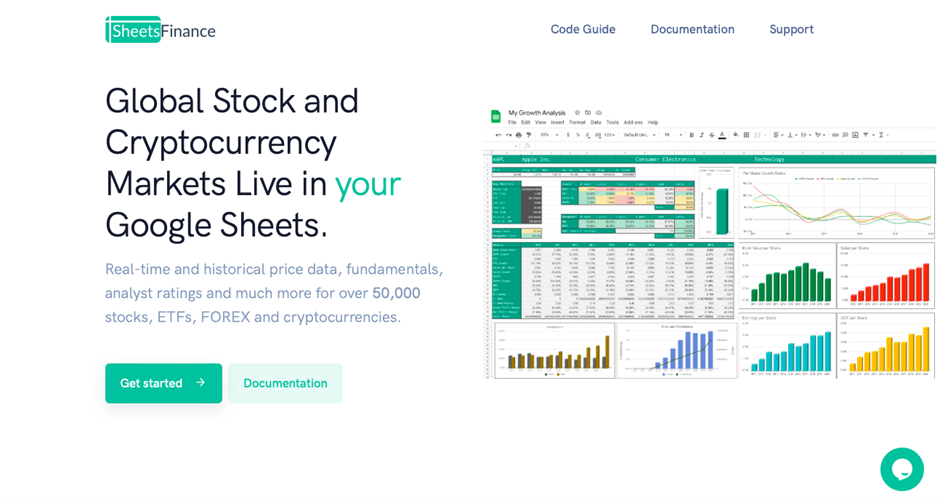
SheetsFinance is an extension that you can install on top of Google Sheets that allows you to analyze companies, cryptocurrencies, and forex, in real-time. It includes the most relevant and popular financial ratios and is fully customizable.
The installation process is very simple, and you will not have major inconveniences. In fact, all you’ll have to do is covered in the following screenshot:
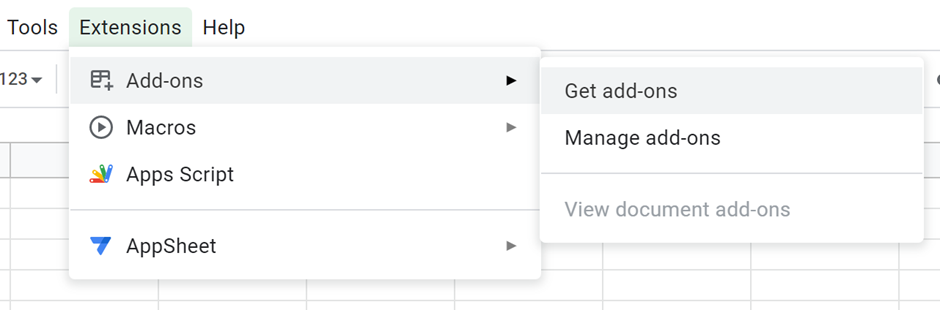
The tool has a series of templates that already come preconfigured and allow for better visualization of the data and makes the research process easier for the user.
However, if you don’t want to use the templates, the extension is fully customizable. You can import the financial statements of a company for a given period, its price history, and the most popular ratios; amongst other datasets.
While the SheetsFinance tool doesn’t have a limited data quota, Google Sheets does. On a given day, you can “only” perform 20,000 requests per account, so if you use other plugins on different sheets, they will count towards your overall external data quota.
Perhaps the best advantage of this tool is the amount of data that can be accessed for a very affordable price.
However, accessing this information requires the use of custom formulas, so if you are not familiar with Excel, it may be difficult to fully use the extension.
Having said that, it is a very powerful tool that will undoubtedly improve the quality of your analysis. And, also, better track your portfolio. Also, if you’re not already an excel poweruser, financial markets analysis might be the perfect excuse to become one.
AlphaResearc
Doing good research is not an easy endeavor given the vast amount of information available on the web. And even more taxing is analyzing the raw format in which companies present their financial statements. That’s what AlphaResearch was created for. This tool allows investors to extract information from presentations, transcripts, and unstructured texts, in order to facilitate the task when conducting research and/or analysis.
The main advantage for managers is the possibility of quick access to information, whether it is in unstructured texts or presentations, and to be able to bring it closer to their investors in order to improve their returns.
The AI that AlphaResearch offers allows you to find exact same information on many similarly structured documents in a short time and without manual labor. Since the new style of presentation of results, reports, and transcripts makes it more tedious to interpret the information, their IA offers an interesting solution for collecting the information and making it easier to ingest.
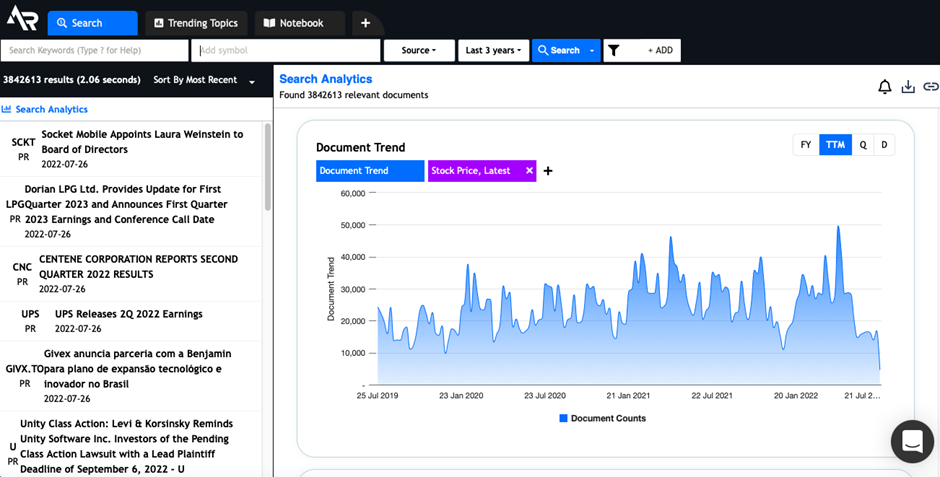
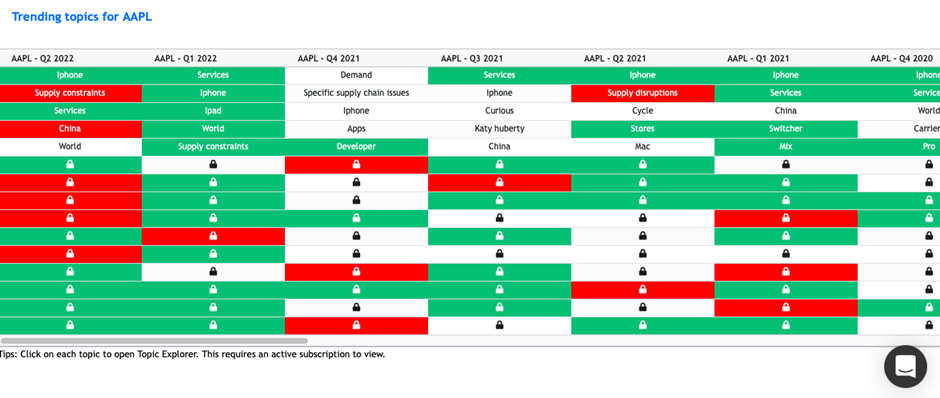
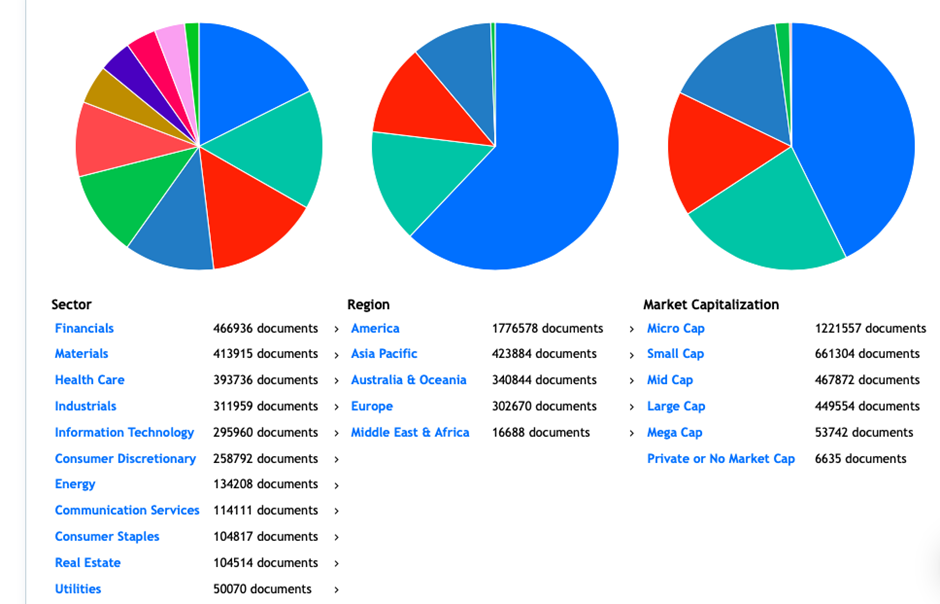
Also, interestingly, in the “Trending Topics” section, you can see the most used words in the companies’ earnings presentations.
Additionally, the software allows you to filter the search for documents by sectors, capitalization and regions. This facilitates the search for information and saves time.
Of course, accessing all this information comes at a cost, but if you are a manager or manage third-party accounts, the subscription would be worth it.
If you are a private investor, you could not get the most out of it. But this does not mean that this tool will not help you. By registering with your email, you have a free trial day that will let you test if it is worth it for you to have access to all this information.
Quantocracy
Quantocracy is a website where you can find mainly quantitative and empirical trading articles. Regarding these articles, there are some rules to be able to publish on their blog:
- They must be quantitative in nature. One should try to reach a conclusion empirically.
- Tested results must be shown. In other words, the results have to be reproducible.
- They must be up to date, at least during the last 48 hours.
If you are interested in quantitative trading, it is a website that is worth it for you should to visit. And if you have not yet entered this trading style, I suggest you visit it anyway, because it has a lot of valuable information and insights into different trading strategies and techniques. And most importantly, you do not have a monthly or annual subscription to pay.
StockTwits
Within the social networks for investors and traders, StockTwits stands out due to them having over three million subscribers around the world.
The stock market today is a complicated environment where information abounds. Fake News, bots, and an overall high noise-to-signal ratio make it difficult for the user to extract valuable information. That’s why StockTwits tries to ensure that its users have everything they need at their disposal to get relevant information and timely updates on their favorite stocks, cryptocurrencies, futures, currency pairs, and more.
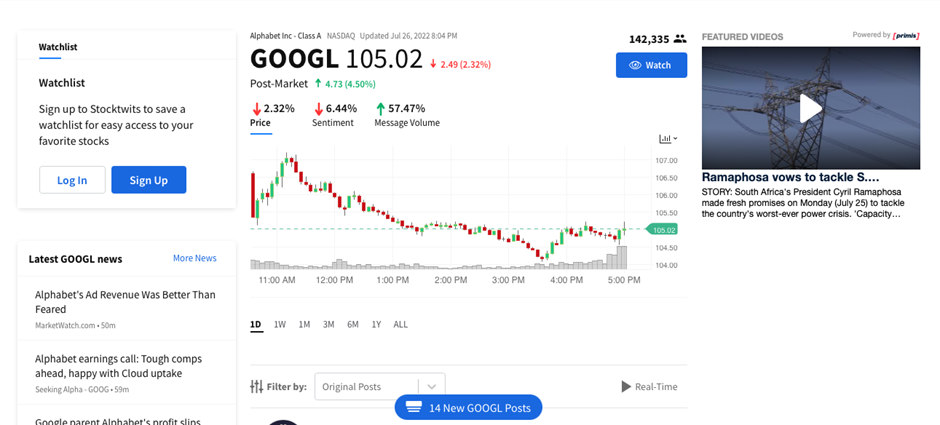
StockTwits has a “rooms” section that allows users to join the different communities that best resonate with their interests and preferences. This way, they can filter the discussions and topics that they want to follow and participate in.
Accessing and participating in these rooms can facilitate your operation, and being in constant communication with other traders makes it easier to learn and improve.
Apart from the rooms, StockTwits has an “Earnings” section, that will allow you to track the earnings disclosures of the companies you follow.
In addition, it has a heatmap that is similar to the one that we already covered in Finviz.
Overall, it is a very complete platform that should not be ignored by any day trader. Paying the subscription would be worth it if you are interested in connecting with other traders. On top of it all, it is a reasonably priced subscription.
If none of this sound interesting to you, it might still be worthwhile checking out their website, due to the number of free tools that they host.
EDGAR (U.S. Securities and Exchange Commission)
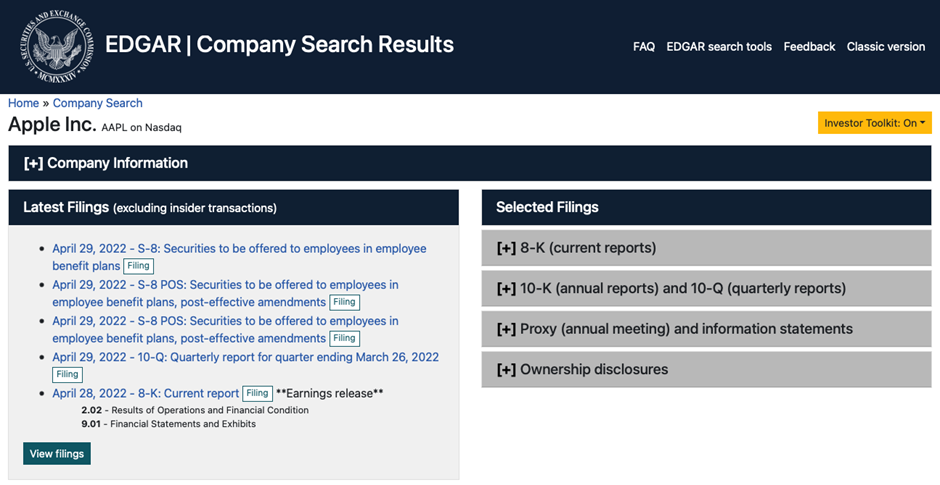
The EDGAR (Electronic Data Gathering, Analysis and Retrieval) database is a tool offered by the US Securities and Exchange Commission, better known as the SEC.
This open-source system processes approximately 3,000 files per day, provides up to 3,000 terabytes of publicly available information per year and hosts an average of 40,000 new files per year. As an online database of business information, Edgar is a one of its kind type of platform. They host a pletofra of information such as Annual and Quarterly reports, Registration Statements (required for IPO’s), Form 8-K (important events such as bankruptcies), Forms 3 and 4 (ownership information), etc.
Using EDGAR, information can be obtained in a simple and reliable way detailing the risk of companies, legal procedures, consolidated financial data, internal analysis, and corporate reports.
Some of the reports that are filed with the SEC can be:
- 10Q Filings: All public companies are required to file these financial reports with the SEC. They are not audited, but can provide a lot of information about a company’s financial health, holdings, or transactions.
- 8K presentations: Changes that may affect the value in the market, such as the resignation of its CEO.
- 10K Filings – These are audited financial reports that will detail financial health.
If you are interested in accessing the data presented by companies, this is the best website to do so.
However, the amount of information it contains can be overwhelmong for beginner investors. It should be remembered that EDGAR is a database and not software. As such, it does not thrive at presenting information in the most succinct and clear way possible.
It goes without saying that one of its most relevant features is also the fact it does not require any subscription to access the database.
Oanda’s Currency Correlation
Before describing this feature, it is important to mention that this is just a free tool offered by Oanda, but not at all their core business (Foreign Exchange broker and data provider).
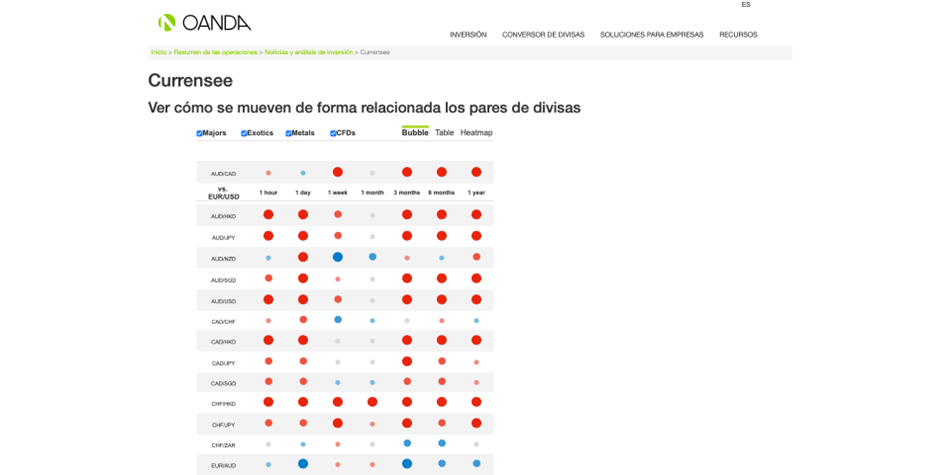
When trading forex, it is important to know the correlations between currencies. Understanding in which direction different pairs move is an important aspect when trading currencies in the market. The Pearson Correlation Coefficient ranges from -1 to +1, where -1 is a perfectly inverse correlation, and +1 is a perfectl positive correlation. It means that by comparing the pairs against the dollar, if the correlation between the pairs is +0.5, each percentage point that the dollar changes will have, on average, a 0.5% move in the same direction as the other asset.
This website lets us check the correlations between any given currency pair and EUR/USD, in a simple way. It is free and is essential for those who operate in the foreign exchange market.
Access OANDA’s currency correlation matrix
World Quant University
WorldQuant University is the leading global education university for financial data science and quantitative modeling. They offer completely free programs whose main objective is to foster access to resources and certifications that otherwise tend to be very expensive.
WQU is an initiative of the WorldQuant group, which is a global quantitative asset management company. It has more than 750 employees around the world who develop and implement investment strategies in a wide variety of assets in global markets.
WorldQuant University offers two degrees for free:
- Master of Science Program
- Applied Data Science Lab
Master of Science Program
Lasting two years, graduates of this program will be prepared for sought-after positions in the stock market, banking, and financial management industries.
Applied Data Science Lab
Spanning sixteen weeks, students will write their own code and explore real-world data sets. The interesting thing about this course is that it is self-paced, but students must complete eight projects that range from exploring housing prices in different countries to predicting air quality. All projects are based on publicly available data sets.
In order to access to this free course, you must have basic knowledge of Python, basic knowledge of statistics, and have passed an admission exam with 66% of the correct answers.
Go to World Quant Universiy’s Website
OpenBB
OpenBB is a free open source terminal that provides a modern integrated environment based on Python for investment research, with the great advantage of making it easier for retail investors to access high-cost information completely free of charge.
As a modern Python-based environment, OpenBB integrates with numerous Python data libraries in Data Science (Pandas, Numpy, Scipy, Jupyter), Machine Learning (Pytorch, Tensorflow, Sklearn, Flair), and Data Acquisition (Beautiful Soup and numerous third-party APIs).
The terminal is installable on both Mac and Windows, and the documents are uploaded on GitHub.
In the terminal, you’ll be able to access both company reports as well as a wide variety of fundamental and quantitative techniques. In addition to stocks, the terminal focuses heavily on Cryptocurrencies, allowing to retrieve order book information, among other rich features.
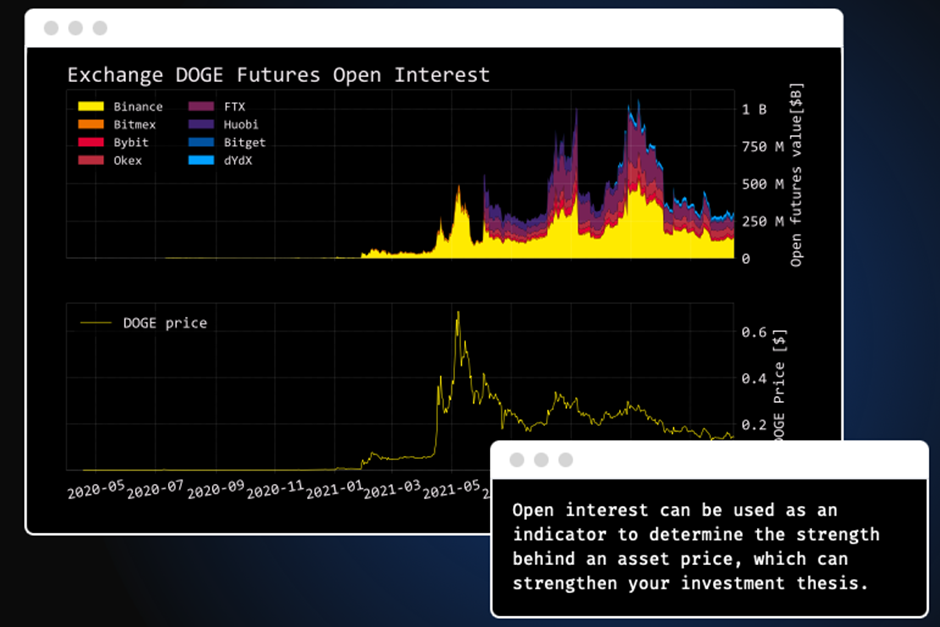
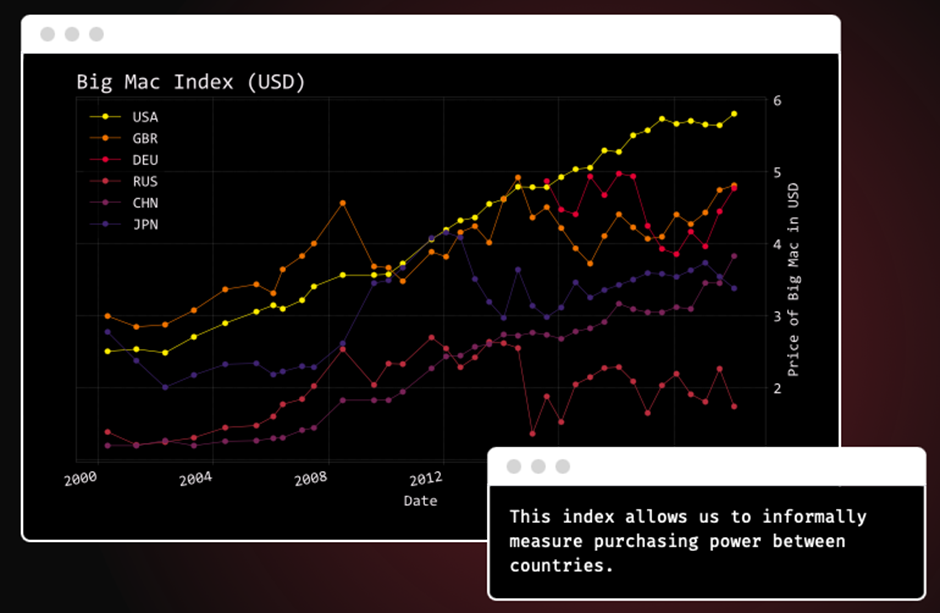
As if that were not enough, the terminal provides updated economic information, such as the famous “Big Mac” index, and economic data presented by FRED; among other.
Having said that, it is recommended/required to know how to code in Python and how to use a Command Line Interface (CLI) to be able to handle the terminal and to be able to apply the correct commands in the console.
Conclusion
As seen, there are countless resources available for free or reasonable subscriptions that allow retail investors to have access to previously unaffordable information. In the current article, I had to leave out lots of tools and resources that are also valuable to limit the length of the post to a reasonable size. However, if you consider that I should have included a website, please contact me or mention it in the comments!
No responses yet