
If you have never automated a trading strategy, you probably think it is an almost impossible endeavor that requires years of programming experience. In this tutorial, I will try to convey that it is by no means rocket science, and I will show, step-by-step, how to create a reliable trading bot.
In short, we will create a trading bot that trades multiple assets simultaneously based on 1-minute price bars. To be as broker-agnostic as possible, we will use Yahoo Finance as our data source and implement a tradelog that can be replaced with an interface to the broker of your preference.
I strongly recommend not just copying and pasting the code but also reading the explanations since they are equally important. Knowing the reasons behind some decisions I made might probably be the most relevant paragraphs of this article.
Table of Contents
Defining the Trading Bot
Defining the logic behind a trading bot is one of the most critical aspects of implementing an algorithmic trading strategy. Additionally, any system you want to trade live in the markets should be researched and tested extensively.
Since this tutorial deals with the implementation of a strategy, we will assume that we have come up with a reasonable strategy that has the potential to be profitable in the future in a risk-adjusted way. This is, of course, a massive assumption, and by no means have I done so to come up with this set of trading rules.
We will create a long-only trading bot that buys a given asset whenever a fast-moving average crosses a slow-moving average from below. By fast and slow, we refer to the number of periods each indicator uses to calculate the average. The slower one will use more bars to calculate the average and will thus “react” slower to new data. The strategy will trade based on 1-minute price bars.
You can see that by no means is this algorithm a complex one. This is not a mistake since I wanted to keep things as straightforward as possible while trying to convey as many good practices simultaneously.
This trading bot does have a few exciting features, such as:
- Trades exactly once per minute when a new bar opens
- Can trade multiple assets at once (both stocks and cryptocurrencies)
- Fetches live and up-to-date data from a Yahoo Finance
- Keeps track of each asset’s holdings
- Keeps a trading log with the time, asset, quantity, and price of each trade
- It is generic enough to be used with any broker
Fetching data and creating technical indicators
Before going through the code itself, you should have Python installed on your local computer. If not, you can go ahead and use Google Colab and run the code on your browser. Having access to a Python environment is outside this article’s scope, but Google Colab requires no setup at all and is free of charge for our purpose at hand.
I wanted this tutorial to have as few dependencies as possible, but we will nonetheless have to install one or two libraries, the first one being yfinance (Yahoo Finance):
# If using a local terminal:
pip install yfinance

# If using google colab:
! pip install yfinance
YFinance is the most popular python library for retrieving financial information. It does not only provide access to historical price data but also financial statement data and other exciting datasets. If you want to learn more about this library, check out this tutorial I wrote.
Let’s create a simple example snippet to make sure that the library is installed correctly and to show the basics:
import yfinance as yf
asset = yf.Ticker("AMZN")
start_date = (datetime.now()-timedelta(days=1)).strftime('%Y-%m-%d')
df = asset.history(start=start_date, interval='1m')
del df['Dividends']
del df['Stock Splits']
del df['Volume']
print(df.tail(10))
After importing the library, we create an instance of a Ticker object for retrieving data related to Amazon and use it in line [4] to fetch 1-minute bars for the most recent day.
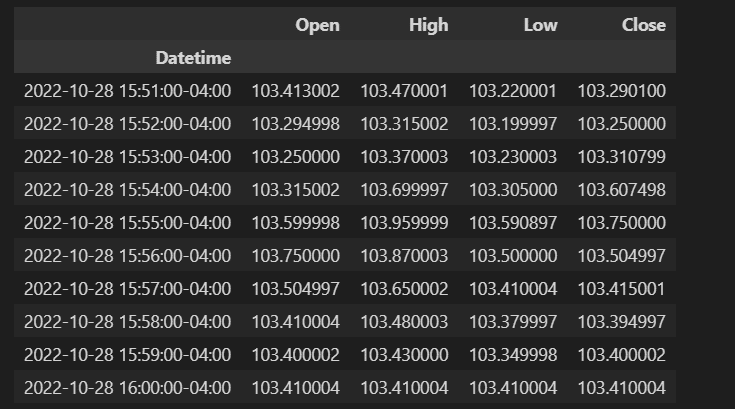
The history() function returns a pandas DataFrame with OHLC (Open, High, Low, Close) data that also has a few extra columns that we can get rid of, and that is what we do on lines [5]-[7]. Lastly, we print the 10 most recent bars to make sure that everything looks as expected:
The next step consists of calculating technical indicators, which in this tutorial will be two simple moving averages. We could calculate them using straightforward DataFrame manipulations, but I used the pandas_ta library instead. This library will allow you to leverage its functionalities and quickly implement dozens of technical indicators without coding them yourself. You can read more about the library on its GitHub repo.
pip install pandas_taUse the following code to add two new columns to our Amazon DataFrame:
import pandas_ta as ta

df['SMA_fast'] = ta.sma(df['Close'],10)
df['SMA_slow'] = ta.sma(df['Close'],30)
If you’ve never used DataFrames, we add new columns (‘SMA_fast‘ and ‘SMA_slow‘). To each, we are assigning the values, which are calculated by pandas_ta. In this case, the fast SMA uses the ten most recent price bars, whereas the slow one uses thirty minutes.
To see the result let’s print the ten most recent bars:
df.tail(10)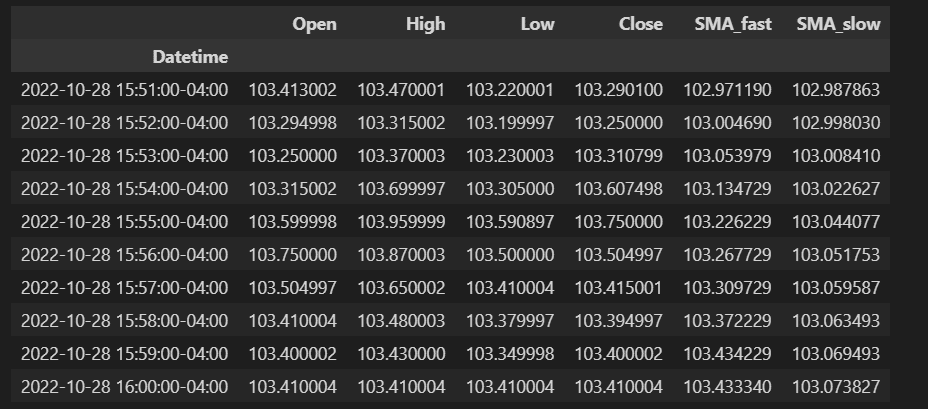
As expected, it looks the same but with two additional columns!
Now that we know how to do all the required basic manipulations, we can start implementing the strategy.
Simple Single-Asset Trading Bot
This section will lay out the base version of our trading bot, which we will sequentially further improve and refine in the subsequent sections. I strongly recommend not skipping these sections to understand better what is happening.
Remember: this strategy is not a valid one, but the code is. In other words, what’s important is for you to understand the code so you can tweak it and implement your ideas.
Following the logic we described in the preceding sections, we are interested in doing something like the following:
if df.iloc[-1]['SMA_fast'] > df.iloc[-1]['SMA_slow']:
    print('We should buy the asset!')
else:
    print('We should sell the asset!')
Although we calculated the rolling series of moving averages, we need the most recent value of each, and for that, we use the iloc (“index location”) method. The “-1” subscript indicates that we want to start from the bottom of the DataFrame (the most recent value).
This simple if-else statement is, in a nutshell, what we expect our strategy to do. Of course, there are other features that our bot requires, such as:
- Iterate once per minute
- Update the data used for calculating the signals
- Checking whether we already hold the asset
- Create a log of the trades triggered by our algo
The following snippet implements those features all at once:
import time

ticker = "AMZN"
asset = yf.Ticker(ticker)
interval_fast = 10
interval_slow = 30
currently_holding = False
tradelog = []

while True:
    start_date = (datetime.now()-timedelta(days=2)).strftime('%Y-%m-%d')
    df = asset.history(start=start_date, interval='1m')
    del df['Dividends']
    del df['Stock Splits']
    del df['Volume']

    df['SMA_fast'] = ta.sma(df['Close'], interval_fast)
    df['SMA_slow'] = ta.sma(df['Close'], interval_slow)

    price = df.iloc[-1]['Close']
    if df.iloc[-1]['SMA_fast'] > df.iloc[-1]['SMA_slow'] and not currently_holding:
        print(f"Buy {ticker}@{price}")
        tradelog.append({'date':datetime.now(),'ticker': ticker,'side': 'buy','price': price})
        currently_holding = True

    elif df.iloc[-1]['SMA_fast'] < df.iloc[-1]['SMA_slow'] and currently_holding:
        print(f"Sell {ticker}@{price}")
        tradelog.append({'date':datetime.now(),'ticker': ticker,'side': 'sell','price': price})
        currently_holding = False

    time.sleep(60)
We start by declaring a few variables we will use throughout the strategy. The ‘while True‘ is none other than an infinite loop and is analogous to telling the code within the loop to keep repeating itself as long as one equals one. According to world-renowned mathematicians, this tends to hold true!
Inside the loop, we start by updating the DataFrame with fresh data from Yahoo Finance and perform all the data manipulations that we previously covered. The step of deleting the columns is entirely unnecessary and could be removed. You can go ahead and do it if you so wish.
In addition to checking whether the moving averages trigger a buy or sell signal, we also check for whether we already own the asset or not. Additionally, whenever we buy or sell the asset, we update the ‘currently_holding‘ variable and add the trade to the tradelog.
Finally, before ending each iteration and starting the next one, we instruct our strategy to wait 60 seconds before doing so. Waiting 60 seconds is an oversimplification and is by all means suboptimal. If we were to start the script at 12H:00M:20S, it would execute 20 seconds after each new bar. Moreover, it will shift a little bit since, in reality, it will iterate every 60 seconds + the time it takes to do an iteration.
At the end of this article, I’ll leave a function that instructs the strategy to wait until the next minute bar instead of just once every 60 seconds.
Multi-Asset Trading Bot
Now that we implemented the strategy for one single asset let’s make a few tweaks to allow it to trade multiple assets all at once.
We will do this by creating a list of dictionaries. Each asset will have its own dictionary and will contain the variables that we used in the single-asset case: ticker, yfinance object, and whether we are holding it.
The following code snippet contains a few randomly chosen assets. Feel free to modify the list of assets to suit your needs!
asset_list = [
    {'ticker':'AMZN', 'yfticker':yf.Ticker('AMZN'),'holding':False},
    {'ticker':'GOOG', 'yfticker':yf.Ticker('GOOG'),'holding':False},
    {'ticker':'NFLX', 'yfticker':yf.Ticker('NFLX'),'holding':False},
    {'ticker':'MSFT', 'yfticker':yf.Ticker('MSFT'),'holding':False},
    {'ticker':'TSLA', 'yfticker':yf.Ticker('TSLA'),'holding':False},
    {'ticker':'BTC-USD', 'yfticker':yf.Ticker('BTC-USD'),'holding':False},
    {'ticker':'ETH-USD', 'yfticker':yf.Ticker('ETH-USD'),'holding':False},
]
Finally, we will have to loop over each asset on each iteration. The following code does exactly that, and as you can see, it requires little to no additional modifications if you have already implemented the single-asset version!
while True:
    for asset in asset_list:
        start_date = (datetime.now()-timedelta(days=2)).strftime('%Y-%m-%d')
        df = asset['yfticker'].history(start=start_date, interval='1m')

        del df['Dividends']
        del df['Stock Splits']
        del df['Volume']

        df['SMA_fast'] = ta.sma(df['Close'], interval_fast)
        df['SMA_slow'] = ta.sma(df['Close'], interval_slow)

        price = df.iloc[-1]['Close']
        if df.iloc[-1]['SMA_fast'] > df.iloc[-1]['SMA_slow'] and not currently_holding:
            print(f"Buy {asset['ticker']}@{price}")
            tradelog.append({'date': datetime.now(), 'ticker': asset['ticker'], 'side': 'buy', 'price': price})
            currently_holding = True

        elif df.iloc[-1]['SMA_fast'] < df.iloc[-1]['SMA_slow'] and currently_holding:
            print(f"Sell {asset['ticker']}@{price}")
            tradelog.append({'date': datetime.now(), 'ticker': asset['ticker'], 'side': 'sell', 'price': price})
            currently_holding = False

    time.sleep(60)
If you let the code run for a few minutes, it will hopefully make a few trades, which you can see in the tradelog:
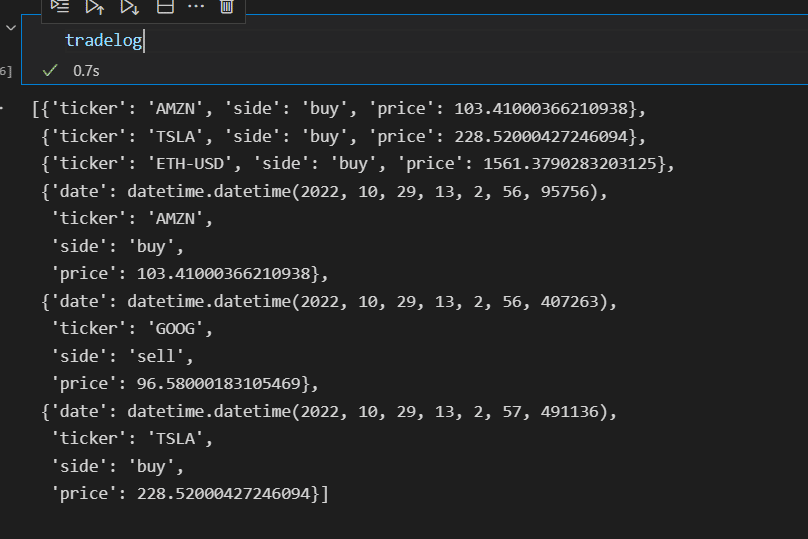
Before moving on to the next section, I wanted to briefly mention a strong (and unreal) assumption I introduced in the code. When logging a new trade, we use the most recent closing price as the price at which our order was filled. This assumption has two shortcomings:
- We would probably fill our orders at a worse price since buy market orders get filled at the ask and sell market orders at the bid.
- We are including the most recent close price for calculating our indicators while simultaneously using it as the fill price. This is unfeasible and is referred to as ‘lookahead bias,’ which is the practice of doing calculations with data that would not be yet available in a real-life scenario. A standard solution is to assume that our order will get filled at the open price of the next bar.
Now that we covered this disclaimer let’s further improve our code!
Improving the Trading Bot
As I mentioned in a previous section, we would like our trading bot to iterate at the start of each new 1 Minute bar, which is not the same as once every 60 seconds. If you don’t recall the issue with this, here it is:
If we were to start the script at 12H:00M:20S, it would execute 20 seconds after each new bar. Also, it will shift a few extra seconds on each iteration since it takes 60 seconds (our pause) + the time it takes to do an iteration.
The following function returns the remaining seconds until a new minute starts.
import math
def get_pause():
    now = datetime.now()
    next_min = now.replace(second=0, microsecond=0) + timedelta(minutes=1)
    pause = math.ceil((next_min - now).seconds)
    print(f"Sleep for {pause}")
    return pause
In short, we subtract the current DateTime from the DateTime of the next minute, resulting in the number of seconds we will have to wait. Additionally, we use math.ceil (ceil ng) to round the number up instead of to the nearest whole number (which could lead to pausing until MM:59S).
To make use of this function, we have to replace our current pause with the following line of code:
time.sleep(get_pause())After each iteration, the trading bot will pause for the number of seconds that the function ‘get_pause‘ returns.
Connecting the Trading Bot to a Stock Broker or Crypto Exchange
After modifying this code to accommodate your indicator-based custom strategy, you can execute it and use the signals to place orders manually. This is a good approach since the first versions of a trading bot oftentimes have bugs that could trigger unwanted orders. So, it is an excellent idea to manually create the orders to ensure that the bot behaves as expected.
Although this code adds a hypothetical trade to the tradelog, the script is versatile enough to perform requests to your broker without much refactoring (Interactive Brokers, Alpaca, Binance, Coinbase, etc.).
If you want to go ahead and interface with a stock broker or a crypto exchange, you can check out some tutorials I’ve created:
Conclusion
As you can see, getting a trading bot up and running is by no means rocket science. Coming up with a good and reliable trading strategy will prove to be a more challenging endeavor. Automating a rule-based trading strategy is, in most cases, almost a trivial task once you know how to do it, and in this article, we laid out the groundwork for you to get started on the right path.
No responses yet