
Backtesting a trading strategy in Tradingview is straightforward, but it does require writing a few lines of code in Pinescript. As you will see, this is also relatively easy, and no prior coding knowledge is required to start backtesting immediately. Still, if you want to dig deeper into Pinescript, look at this tutorial I wrote.
Before getting started with this tutorial, it’s worth mentioning that TradingView’s backtest features are rather limited, especially when it comes to reporting capabilities. This is why we developed BacktestXL, the most rigorous backtesting engine that works natively within Microsoft Excel. In addition to having industry-grade backtesting features, it allows one to fetch historical prices, and alternative datasets, calculate technical indicators, detect trading patterns, and optimized the strategy’s parameters.
Table of Contents
Creating a Strategy in Tradingview
Pinescript is best learned by just diving straight in, so in the following example, we will create an absurdly simple strategy whose logic is as follows:
- Long when: fast moving average is greater than slow moving average
- Short when: fast moving average is smaller than slow moving average
As you might have guessed, we should not expect to get rich by following this set of rules. If we end up with a good-looking set of backtesting metrics, it will be entirely attributable to luck, and by no means should we feel pat ourselves on the back and think we are geniuses.
Having said that, let’s cut to the chase and get started!
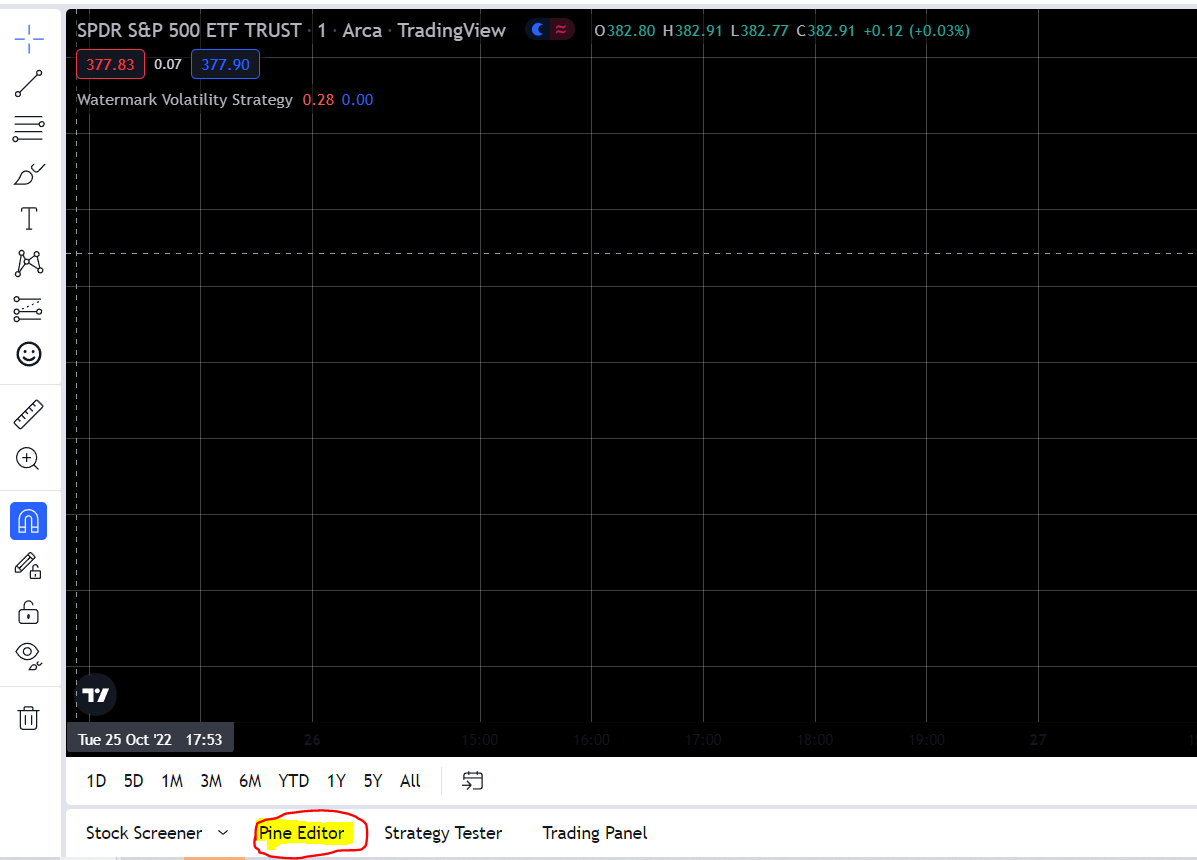
The first thing we will do is open the ‘Pine Edit’, which you can find on the bottom left of your screen (image below).
You should now see a few lines of code describing the version, instantiating an indicator, and plotting it on the chart (code below).
//@version=5
indicator("My script")
plot(close)
In short, this automatically created template creates an indicator called “My Script,” and it will plot the closing price of each bar. We need to make a few adjustments to the code since we are interested in creating a backtest and not an indicator.
To let Tradingview know that we are going to be testing a strategy, replace the line that declares the indicator with the following code:
strategy("Simple SMA Crossover Strategy", overlay = true)
This will instantiate a strategy, which in this case, is called “Simple SMA crossover Strategy.” The overlay parameter indicates whether the strategy should be displayed on top of the chart or in a separate pane. I personally prefer to show it on top of the bar chart, so I set the parameter to “true.”
The next step consists in laying out the logic that we want our strategy to follow, and to do so, we need to calculate two simple moving averages:
fast_sma = ta.sma(close,12)
slow_sma = ta.sma(close,24)
Pinescript is not like other programming languages. Despite having a few limitations, it was created with the sole of trading in mind. As such, it has lots of built-in functions that allow us to implement popular technical indicators without having to code them from scratch.
In this case, we implemented two simple moving averages that use the last 12 and 24 closing prices, but there’s a plethora of indicators you can choose from.
Now that we have the inputs, we need to define the logic for the strategy itself, and this is done in the following lines of code:
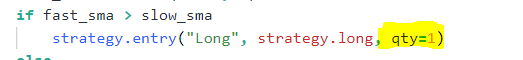
if fast_sma > slow_sma
    strategy.entry("Long", strategy.long, qty=1)
else
    strategy.close("Long")
If you have previous experience with Python, you will immediately understand the indentation. If not, don’t worry!
The first line of code check whether the “Fast SMA” is greater than the “Slow SMA.” If the condition is met, the following indented line will execute.
Otherwise, the line that follows the “else” clause will be the one that gets processed.
The “if” and “else” clauses are mutually executed, meaning that one and only one of them will execute the code inside. In this case, the “else” clause is exactly the same as another “if” statement that checks whether the “Fast SMA” is smaller than or equal to the “Slow SMA”.
You might have guessed what is going on within the conditionals: we are opening a long position for 1 unit of the asset and closing it whenever the signal reverts.
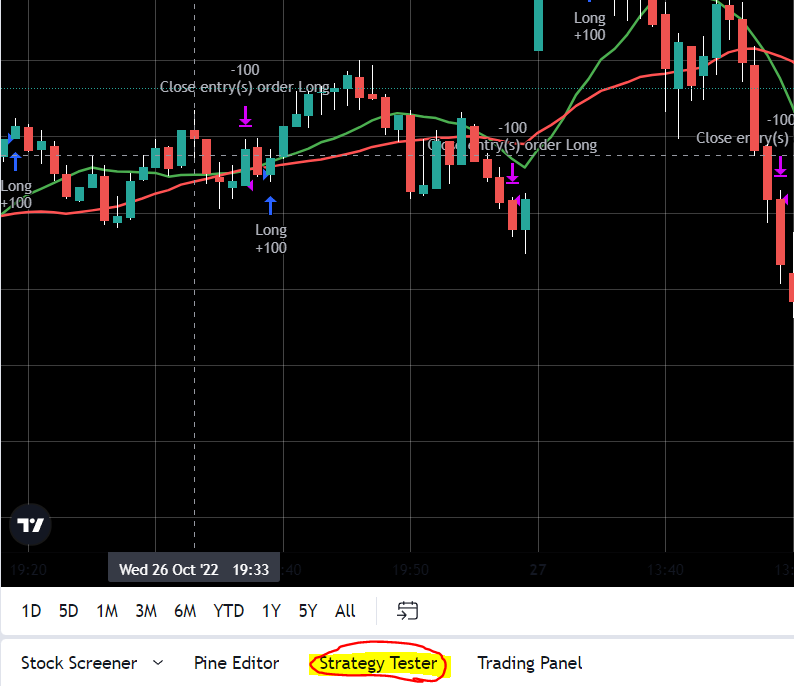
Now, if we go save the script and go back to the charting view, we should be seeing the entries and exits.
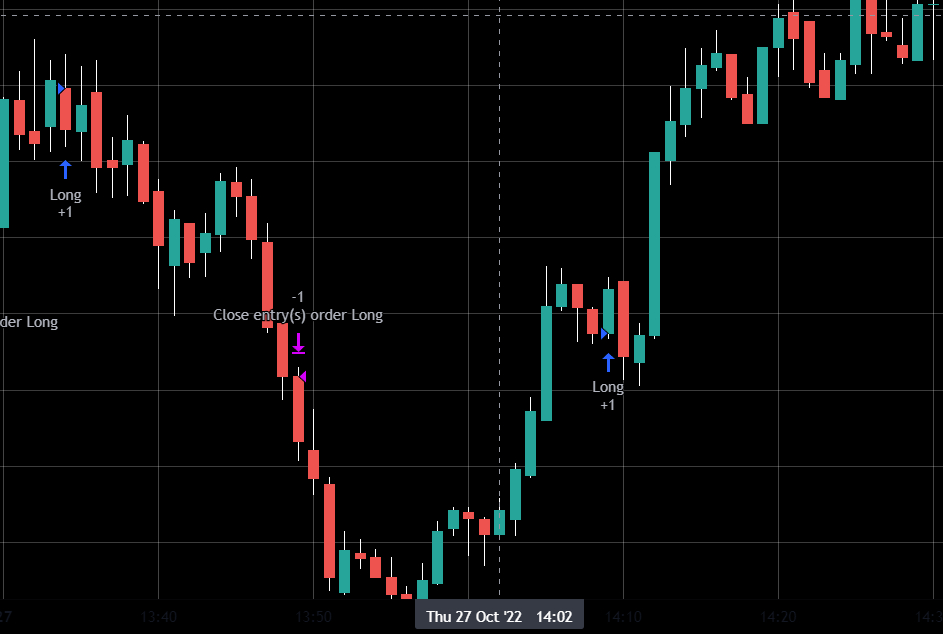
As you can see, the strategy is entering positions whenever the price increases for a few periods and closing them when the price drops. This behavior agrees with what we would expect from a momentum-based strategy. Nonetheless, to ensure that we did not introduce any bugs (ie, mistakes), it would be nice also to see the moving averages plotted. So, let’s go ahead and add the following lines of code in the Pine Editor.
plot(fast_sma,color=color.green,linewidth = 2, title='Fast SMA')
plot(slow_sma,color=color.red,linewidth = 2, title='Slow SMA')
Tradingview includes some powerful charting functionalities that we can use to rapidly plot our data. I won’t go over each parameter of the function since they are pretty straightforward in this case. If you save the script and go back to the chart, you should now be seeing something along these lines:
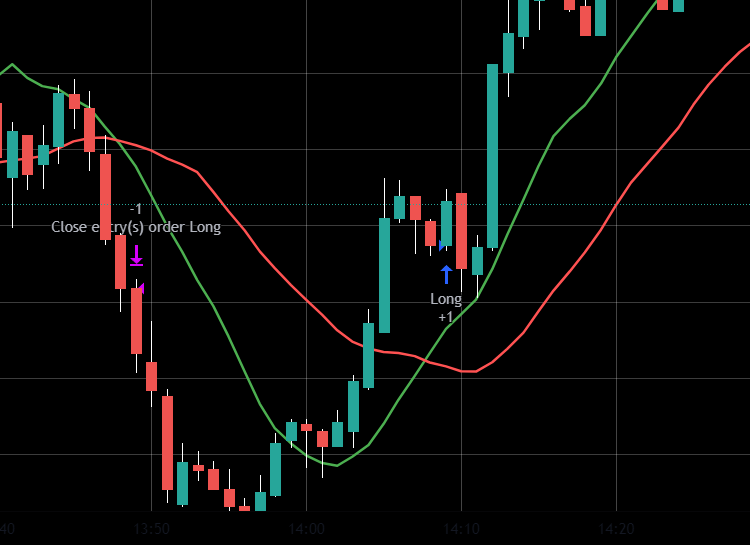
If you pay close attention, you will notice that entries and exits are plotted not on the bar where the moving averages cross each other but on the next.
Although strange at first, this makes perfect sense: a live trading algorithm would not be available to incorporate a new bar until it closes, which is why we would not be able to also trade on it simultaneously.
In backtests, it is a common approach to execute the trades at the opening of the next bar, and this is precisely what Tradingview is automatically doing. Failing to account for this is called lookahead bias and introduces the error of using information that would not be readily available in a live trading environment.
There are lots of common backtesting mistakes that we can make without even noticing it, and you can read all about them in this article.
How to analyze strategy performance in Tradingview
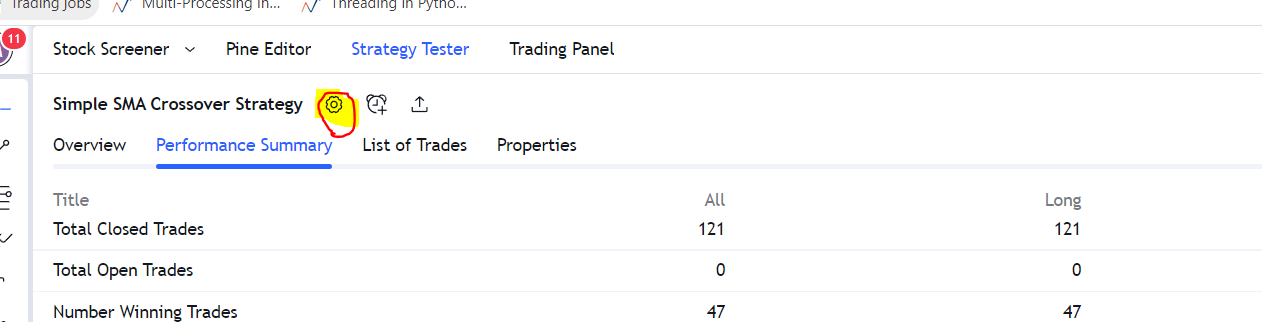
Once we’ve created a strategy, we can click on the “Strategy Tester” ribbon next to the Pine Editor we just used.
Tradingview will present us with lots of metrics that are commonly used in backtesting and strategy performance analysis. You will find a more detailed list in the “Performance Summary” ribbon.
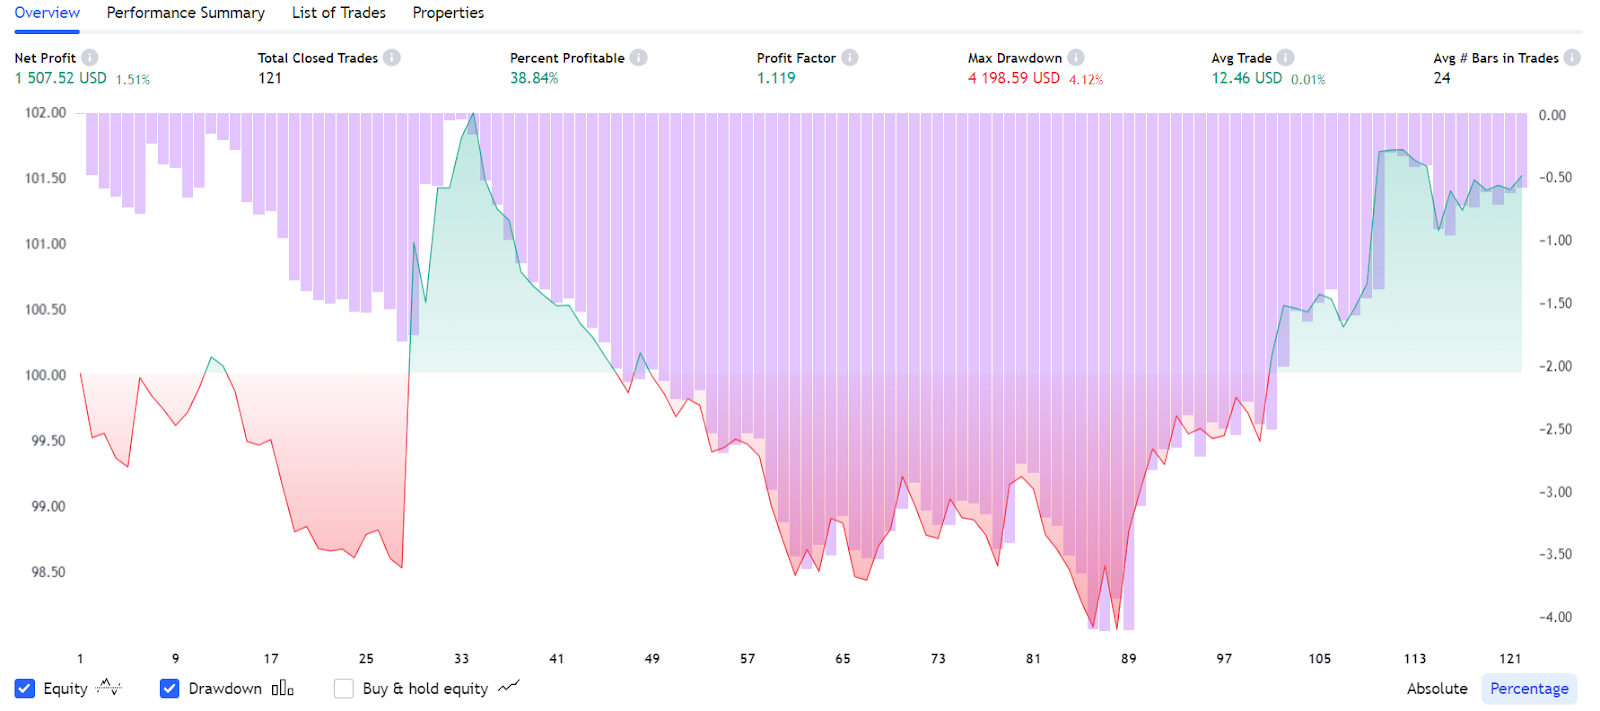
When analyzing the performance of a strategy, it is a good practice to start by looking at the following metrics:
- Net Profit
- Sharpe Ratio
- Average Bars in Trades
- Avg Winning Trade’
- Avg Losing Trade
- Percent Profitable (of trades)
- Max. Drawdown
A common oversight that should be avoided by all means is to ignore the number of margin calls if our strategy uses leverage. Margin calls generate a path dependence on the returns of a strategy and have a significant effect on the overall performance.
Using Accurate Backtesting Settings in Tradingview
The previous backtest has a few limitations and overoptimistic assumptions that would not be replicated in a live trading environment. These can all be tweaked in the settings button within the “Strategy Tester” section (image below).
You will be prompted with the following set of parameters:
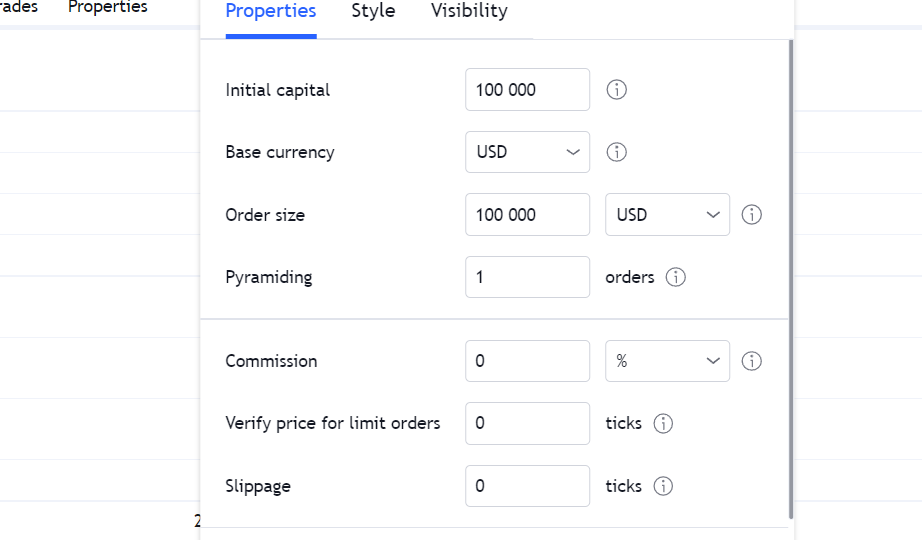
At the risk of stating the obvious, you should set the parameters as similar as possible to your live trading parameters.
Setting realistic backtesting parameters
Some intraday strategies can be highly profitable in gross terms but impracticable in real life due to their inherent execution costs. The more trades your strategy places on a given period of time, the more sensitive it will be to these costs. Thus, properly accounting for them is not only important but essential.
The two most relevant settings you should spend some time setting are Fees and Slippage.
The Fees parameter should be set precisely to the ones offered by your broker, but they usually range between 0% and 0.1%.
Slippage, on the other hand, requires us to make some assumptions. It depends mostly on our order size and the volume traded of the asset we are interested in. The larger our trades, the higher our impact on the order book and the larger our slippage. Also, the higher the total volume traded of an asset, the higher its liquidity and the lower the slippage.
In most cases, setting slippage between 0.05% and 0.15% will be reasonable. It is also good practice to increase slippage in fixed intervals and measure its impact on the strategy’s performance.
The abovementioned values should be more carefully considered and statistically analyzed if you are trading a highly illiquid asset or trading with a large account. But, if you’re trading Tesla with a $25.000 account, these should be a good approximation.
Changing the order size in Tradingview
You might be interested in using a fixed dollar amount per trade instead using a fixed quantity. In my case, I’m interested in expressing it as a percentage of my assets under management. This can be changed in the following input and dropdown boxes:
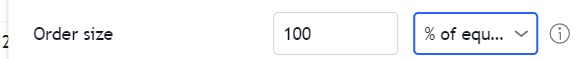
It is worth mentioning that these parameters will be overridden by the code in your Pine Editr, meaning that you should remove any specified quantities from your entries in order to allow for the global settings to have effect.
Is backtesting in Tradingview Accurate?
As with most freely available backtesters, backtesting in Tradingview has a few limitations. Having said that, it has overcome some major limitations in the last couple of years and is nowadays comparable to other trusted engines.
You should only backtest using candlestick bars and never use HeikenAshi, Renko, or Kagi bars. These use the wrong price levels as entries and will yield highly over-optimistic results.
Another limitation that is common to most backtesting engines is the fact that Tradingview operates on closed bars instead of tick data. This means that it does not know the price evolution within a bar and as such, cannot determine if the high occurred before the low or vice-versa.
This forces Tradingview to make assumptions, and it chooses to be optimistic:
- If you’re long, it will assume that the high occurred before the low
- If you’re short, it will assume that the low occurred before the high
Due to this, Tradingview implemented the “Bar Magnifier” option, which does consider intrabar data for more accurately replicating live-trading performance. For example, if you’re trading based on 1 Minute bars, Tradingview will use 5-second bars for executing the trading logic. Sadly, this option is not available on the free plan.
Conclusion
As you can see, Tradingview has a very powerful backtester, capable of delivering reliable metrics on par with most similar tools. This tool will be more than enough for most use cases, but if you ever want to test something related to machine learning, market-making, or high frequency, you must resort to a proper programming language like Python. Until then, Tradingview is the way to go!
No responses yet