
If you’ve ever come across an article describing a trading strategy that is supposed to be infallible, you’ve probably heard about momentum indicators. Although said article probably showed an overfitted backtest instead of a real P&L, momentum-based technical indicators are worth considering.
Momentum describes the tendency of price increases (decreases) to be followed by subsequent increases (decreases). Thus, traders have come up with different formulas that try to exploit this phenomenon.
In this article, I’ll cover the most popular technical indicators for spotting momentum signals. I’ll also provide a list of momentum indicators that I hope is close to being exhaustive.
Table of Contents
Detailed Description of Momentum Technical Indicators
Awesome Oscillator

The Awesome Oscillator is a momentum indicator that consists of two simple moving averages. By subtracting a long simple moving average from a short simple moving, the AO results in a boundless value centered at 0.
Although any lookback period can be used, traders tend to set the short SMA to 5 days and the long SMA to 34. Additionally, instead of using the closing price, the moving averages are calculated by using the median price to better account for volatility.
Awesome Indicator = SMA_short - SMA_long

Where:
SMA_short = average of the last 5 periods median prices
SMA_long = average of the last 34 periods median prices.
The Awesome Oscillator was developed by Bill Williams, an American stock trader also known for developing the Market Facilitation Index.
Moving Average Convergence Divergence (MACD)

The Moving Average Convergence Divergence is one of the most basic and popular trend-following momentum indicators. It consists of three time series: a fast-moving average, a slow-moving average, and a moving average of their differences.
It is common practice to use Exponential Moving Averages (EMAs) instead of Simple Moving Averages (SMAs).
Difference = Moving_Average_fast(a) - Moving_Average_slow(b)
MACD = EMA(Difrerence)
Thus, the MACD requires three parameters and is usually referred to as MACD(a,b,c), where:
- a: window for the fast-moving average (commonly set to 12)
- b: window for the slow-moving average (commonly set to 24)
- c: window for calculating the average differences between EMA_fast and EMA_slow (usually set to 9)
The signal depends on the value of the resulting indicator. Positive values of the average differences are interpreted as a trend-following positive momentum signal, whereas negative values result in negative momentum signals.
Momentum (MOM)

The momentum indicator (MOM) is arguably the simplest indicator on this list; calling it an indicator could be a bit of a stretch. In a nutshell, it is the difference between the current and closing prices of a given number of periods back. In other words, it can be expressed as follows.
Momentum(n) = Price(now) - Close(now - n)As with any trend-following momentum indicator, MOM tries to exploit the fact that price series oftentimes are not completely uncorrelated with respect to themselves (autocorrelation).
As you probably guessed, a positive value signals a positive momentum trend, whereas the opposite indicates a negative trend.
This indicator should never be used as the only signal of a strategy. Instead, despite its simplicity, it is often useful as an additional verification of momentum before an entry.
Rate of Change

The Rate of Change (RoC) is an indicator that measures the relative magnitude at which a price changes over a given period. It can be calculated by computing the ratio between the price of a given period divided by the price of the previous period.
Rate of Change = Price(t) / Price(t-1)As expected, values greater than 1 are the result of a price increase, whereas values lower than 1 indicate a price decrease. Additionally, an RoC of exactly 1 means that the price did not change during the covered period.
The indicator and its use are rather straightforward: a value greater (lower) than 1 indicates positive (negative) momentum. Although simple in nature, this indicator is one of the most widely used due to its simplicity.
Relative Strength Index (RSI)

The Relative Strenght Index, or RSI, is a momentum indicator that oscillates between the values of 0 and 100. According to its developer (Welles Wilder), values above 70 mean the asset is overbought, whereas values below 30 mean that it is oversold.
Since its first publication in the book New Concepts in Technical Trading Systems (1978), the RSI has become one of the most popular indicators.
This, and most of the remaining popular indicators, require very simple calculations since they were developed before the popularization of computers in the financial industry. Thus, computations had to be kept to the bare minimum in order to allow traders to calculate them.
To calculate the RSI, we first start by considering a given number of bars (14 is a common value used). For each period, we calculate the difference in price with regard to the previous one and separate them depending on whether they are upward (U) or downward (D).
If the price increased:
U = close_now - close_previous
D = 0
----------------------
If the price decreased:
U=0
D= close_previous - close_now
After doing so, we individually calculate the average for both upward and downward changes. It is a common practice to use use the simple moving average (SMA) or the exponentially weighted moving average (EWMA).
The SMA is the average that we all know and consists in adding all values and dividing them by the number of values. On the other hand, the EWMA assigns greater weights to the most recent values and exponentially decreases weights to older values. Thus, the EWMA reacts faster to recent movements than the SMA.
Regardless of which moving average we choose to use, we proceed to calculate the relative strength (RS), which is the ratio of the average uptrends dividend by the average downtrends.
Relative Strength = Moving Average(Upward) / Moving Average(Downward)Now, the only step left is to calculate the Relative Strength Index, as follows:
Relative Strength Index = 100 - [100 / (1+RS)]By looking at the formula, we can intuitively see that:
- The smaller the downward changes, the higher the Relative Strength will be. As a consequence, the denominator on the RSI formula increases and therefore decreases the number that gets subtracted. Thus, the lower D is, the closer to 100 the RSI.
- Conversely, the smaller the upward changes (or higher the downward changes), the smaller the resulting Relative Strength value. Thus, by plugging it into the RSI formula, the result will be closer to 0.
A sequence of relatively strong positive price changes results in a higher Relative Strength Index. According to the intuition behind this indicator, this could be interpreted as evidence of positive momentum.
Slope
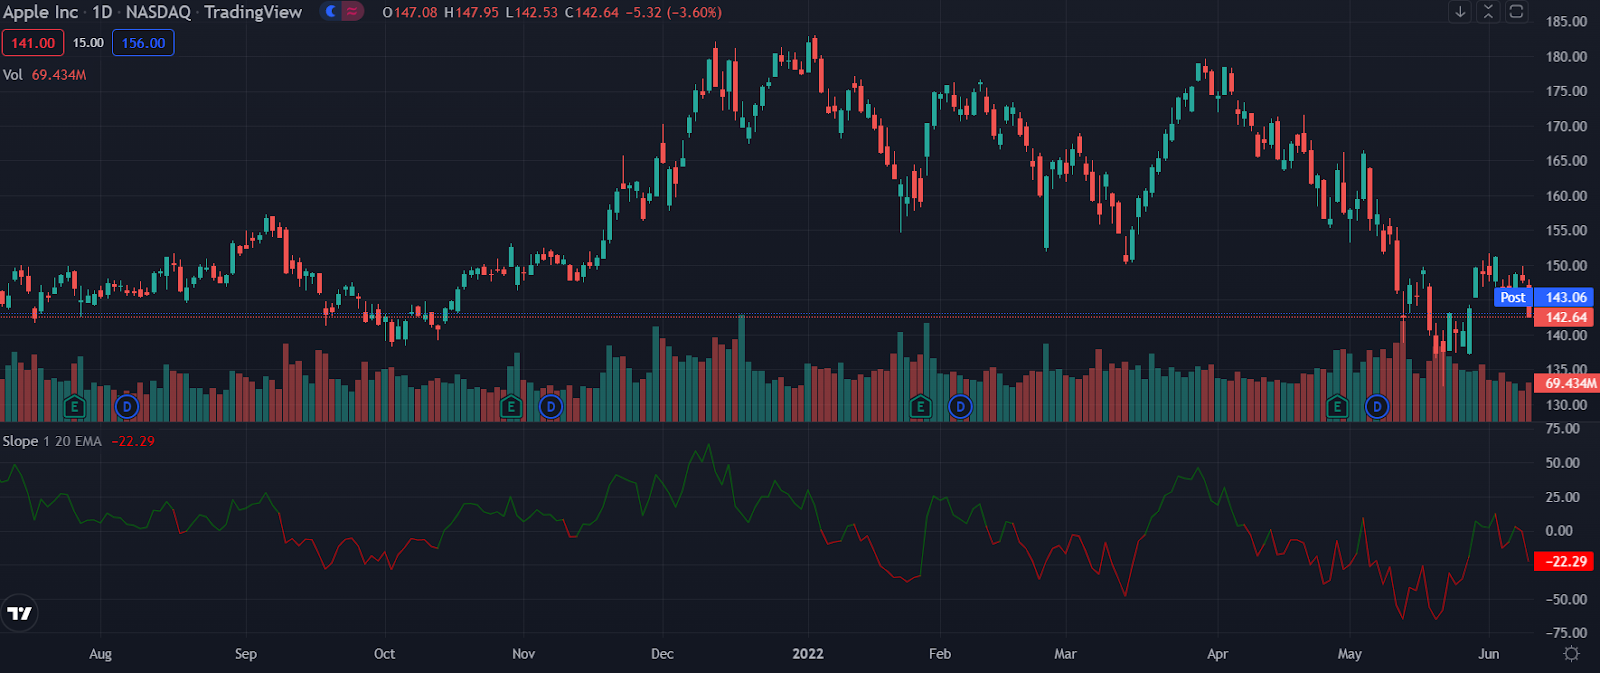
The slope is a popular momentum indicator that is calculated in the same way as the usual definition of slope. In other words, it is none other than the rise over the run. The formula is stated as follows:
Slope(Momentum) = [ Price(t) - Price(t-n) ] / n

Where “n” (aka, the “run) is the number of periods used.
The interpretation of the indicator is as simple as it gets: a positive value (slope) indicates a positive momentum signal, whereas a negative slope indicates a negative momentum signal. As could be expected, this indicator is too simple and weak to yield strong signals by itself. It is usually used simultaneously with other momentum indicators to increase the strength of the signal (at least, in theory).
Although the most common definition of the slope indicator is the one given above, some traders also calculate it using regression analysis. Given a series of prices, linear regression will lead to a straight line that minimizes the sum of the squared distance between each price and the line. Although the calculations of linear regression can be cumbersome to do manually, all data tools worth their salt can calculate it automatically.
Most often than not, the sign of the slope will be the same regardless of the definition you choose to use. But this is not always the case, and the following graph shows a situation in which the two approaches don’t align:

The dotted line in the chart represents the linear regression that best fits the price series of a random asset. As you can see, the resulting slope is positive. On the other hand, if we use the most popular definition, we’ll arrive at a slope of exactly 0, given that the initial and the most recent price equals 100. Thus, [100 – 100] / 5 = 0.
Having stated this important distinction between both approaches, the spirit behind them is the same: a positive change is expected to be followed by a subsequent positive change. In other words, they are both valid momentum indicators.
Stochastic Oscillator

The Stochastic Oscillator is a momentum indicator that compares the closing prices relative to the lowest low and highest high of a given number of periods. Given the formula of the Stochastic Oscillator, the indicator result is bounded between 0 and 100.
In a nutshell, this indicator tries to predict the direction of the price based on the previous closing price relative to the price range of a given timeframe (usually 5 periods).
The Stochastic Oscillator was developed in the 1950s by the trader, educator, and author George Lane. Because of this, the Stochastic Oscillator is sometimes also referred to as “Lane’s Stochastics”. As of today, this indicator remains the most popular momentum indicator used by day traders in the stock, cryptocurrency, and currency markets.
To calculate the SO, we’ll use a timeframe of 5 periods as an example:
%K = (Price - Low_5) / (High_5 - Low_5)

Where:
Low_5: lowest low of the previous 5 periods
High_5: highest high of the previous 5 periods
Furthermore, we calculate a moving average of %K and refer to it as %D:
%D_5 = [ %K_1 + %K_2 + %K_3 + %K_4 + %K_5 ] / 5Although different sources interpret this indicator in multiple ways, we can find some common ground among them. The %K oscillator being above some threshold value (80 being a common one) is a common bullish momentum signal. Additionally, the %K crossing the %D indicator from below is also interpreted as a positive momentum signal. More often than not, traders use both signals in conjunction.
Stochastic RSI

The Stochastic RSI is a blend between the Stochastic Oscillator and the Relative Strength Index. It consists of comparing the current value of the relative strength index to the lowest and highest values of the same indicator over a given number of periods (usually 14).
You can refer to the section regarding the RSI to follow the steps required for its calculation. In the current section, we will assume that we have already calculated them. As a side note, the RSI is bounded to values between 0 and 100.
Stochastic RSI = 100 * [ RSI_current - RSI_lowest ] / [ RSI_highest - RSI_lowest ]We can intuitively interpret the Stochastic RSI as follows:
- If the current RSI is also the lowest, the Stochastic RSI will be 0, indicating that it is extremely oversold.
- If the current RSI is also the highest, the Stochastic RSI will be 100, indicating that it is extremely overbought.
- If the current RSI is the average between the lowest and highest RSI, the Stochastic RSI will be equal to 50. Higher (lower) values for the current RSI will result in a higher (lower) Stochastic RSI.
Following the spirit of other momentum indicators, values over a certain threshold indicate a positive momentum signal. Most often than not, 14 periods are contemplated, and a value of 80 (20) is set as the threshold for positive (negative) momentum.
Other Momentum Indicators
Having covered the most important and popular momentum indicators, it is worth saying that there are countless additional ones that you might consider checking out. I chose not to cover each and every single one in detail in order to keep this article short. Also, most of the indicators in the following list are similar to at least one of the described indicators.
Having said that, this is a list of additional momentum indicators worth checking out:
- Relative Strength Xtra
- Relative Vigor Index
- Schaff Trend Cycle
- Absolute Price Oscillator
- Bias
- Balance of Power
- BRAR
- Commodity Channel Index
- Chande Forecast Oscillator
- Center of Gravity
- Chande Momentum Oscillator
- Coppock Curve
- Correlation Trend Indicator
- Directional Movement
- Efficiency Ratio
- Elder Ray Index
- Fisher Transform
- Inertia
- KDJ
- KST Oscillator
- Pretty Good Oscillator
- Percentage Price Oscillator
- Psychological Line
- Percentage Volume Oscillator
- Quantitative Qualitative Estimation
Are momentum indicators profitable?
There is ample academic evidence about the usefulness of incorporating momentum as a signal for trading strategies. As such, momentum is worth researching when it comes to developing trading strategies.
Having said that, an asset that features some momentum characteristics on a minute basis might feature mean-reverting properties on an hourly time frame. Even so, the effect is not always strong enough to cover transaction costs. Thus, momentum is not a one-size-fits-all feature that will inevitably lead to profitability.
As seen in the previous section, most momentum indicators are extremely simple to compute and understand because they were developed in the pre-computer era. Using the MOM indicator and expecting it to perform above a suitable benchmark in today’s market is probably unreasonable, characterized by quantitative techniques and machine learning models.
Having said that, the value of momentum as a feature should not be underestimated, and most professional quants do properly account for it when researching new strategies.
Which is the most popular momentum indicator?
Although momentum indicators are widely used in all markets, certain indicators are more popular than others. The following chart shows the relative interest of the most popular momentum indicators:
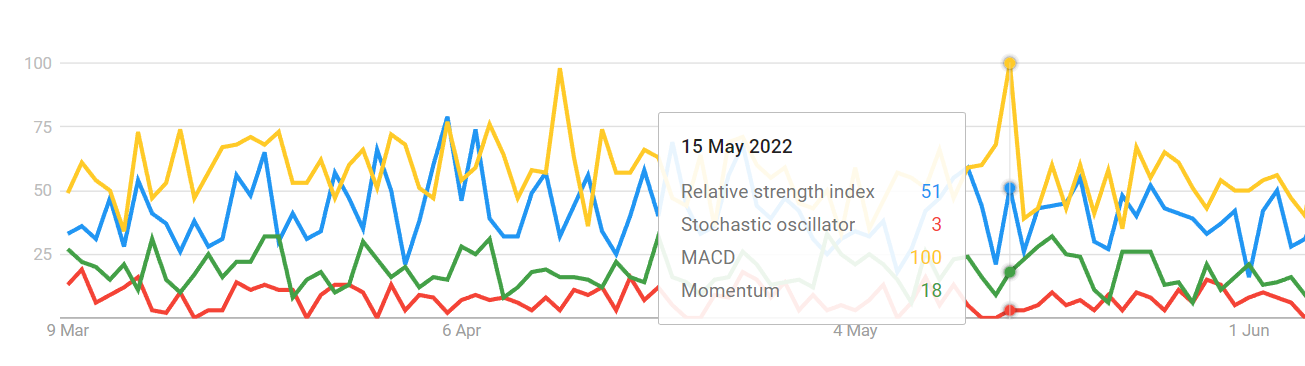
Based on Google Trends, the MACD is the most popular momentum indicator, followed by the RSI, the MOM, and the Stochastic Oscillator. The remaining indicators covered in this article had popularity well below the Stochastic Oscillator.
We should keep in mind that higher popularity is uncorrelated to higher expected profitability. Most probably, the popularity of most indicators relies on their ease of use and not their usefulness.
No responses yet