
When developing a trading strategy that uses technical indicators, we have to choose which ones we’ll incorporate into our algorithm and the values of each parameter.
A common practice is to test different combinations and evaluate how they impact target metrics, like the Sharpe Ratio, annualized returns, or the maximum drawdown. Manually iterating over these is tedious, but most non-coders do not know how to do this in an automated and efficient way. Luckily for us, Excel has some less-known but very powerful features that will allow us to do exactly that!
In this article, we’ll optimize the parameters of a moving average crossover divergence (MACD) trading strategy. By the end of this tutorial, we will have a heatmap of the returns of our strategy under different combinations of parameters.
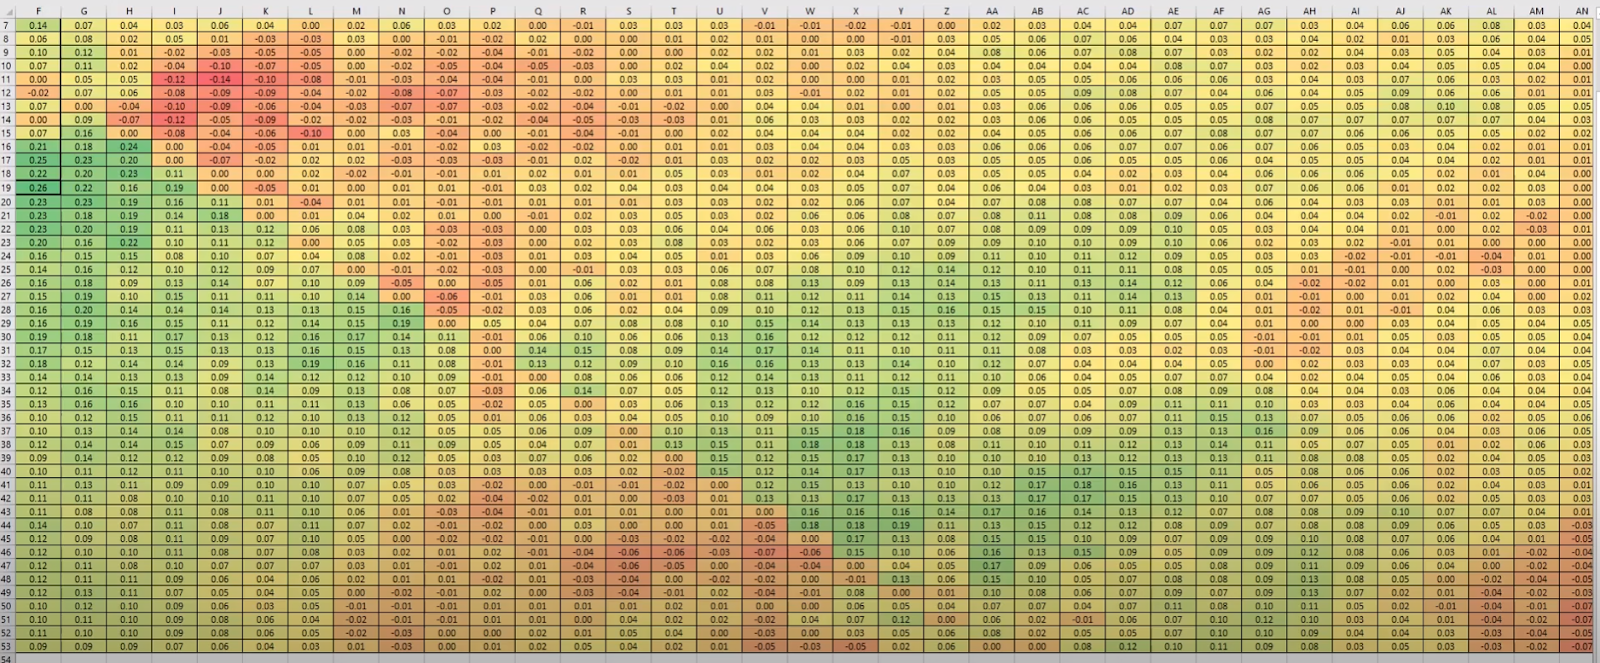
Table of Contents
Backtesting a trading strategy in Excel
We will be using the intraday stock prices of Tesla and trade based on two simple moving averages (SMA’s). This strategy is commonly known as Moving Average Crossover Divergence (MCD).
The moving averages differ concerning their lookback period. The one with a shorter lookback period will react faster to changes in price, whereas the longer one will do so in a slower fashion. The rules for the strategy are as follows:
- Whenever the short SMA crosses the long SMA from below, the strategy issues a buy signal
- Whenever the short SMA crosses the long SMA from above, the strategy issues a sell signal.
The default parameters of this strategy are oftentimes 12 and 24 periods, respectively. Yet, these are completely arbitrary and based only on anecdotal evidence.
I created a video tutorial that shows how to implement this strategy, which you can follow here:
Having said that, if you want to skip this step and go straight to optimizing the strategy, you can download the Excel file from here:
Optimizing the Trading Strategy
for this section, I’ll assume you either followed the previous tutorial or downloaded the workbook. In both cases, you will have a parametrizable worksheet that automatically recalculates the strategy’s performance whenever you change the values of the SMA’s.

The process of optimizing the parameters of a trading strategy is rather simple, and I broke it down into 4 steps.
Step 1: Create the table
We will create a table with the values of the short SMA as the columns and the values of the long SMA in the rows. Each cell will contain the strategy’s returns for each pair moving averages.

Step 2: Choose the target variable to optimize
There are multiple variables that you might want to optimize, such as the total return, the Sharpe Ratio, the volatility, the maximum drawdown, or even a weighted mix of these!
To keep things simple, we’ll be optimizing the total returns of the strategy.
This step is very simple and consists of pasting the formula for the total returns on the top-left cell of our table.
Step 3: Calculate results using Excel’s What-If-Analysis feature
Now that everything is in place, we can use the DataTable functionality within What-If Analysis. This will automatically calculate the function values we pasted on top for each of the values on our rows and columns.
To run the optimization, follow these steps:
- Select the table. Make sure to select the exact range with all rows and columns.
- Go to Data > What-If-Analysis > Data Table
- Select the cell with the value of SMA_1 for “Row-input Cell”
- Select the cell with the value of SMA_2 for “Column-input Cell”
The following Gif explains the previous steps in a friendlier way!

Step 4: Add conditional-formatting
To be able to find the regions with the best results, it is a good idea to apply conditional formatting.
To do this, select the values of our newly calculated table, go to “Home” > “Conditional Formatting” > “Color Scales,” and choose the one you like the most.
Since I already added too many GIFs, I’ll skip this step and show the result:

Voilà! Should you now start trading this strategy expecting to become rich? Most definitely not! In fact, I wrote the following F.A.Q. to dissuade you from doing so!
Frequently Asked Questions
Should you optimize returns or Sharpe Ratio?
Optimizing the Sharpe Ratio is a superior choice over absolute returns. The latter completely ignores volatility or any notion of risk, making it a poor choice of an objective variable.
In this tutorial, we focused on finding the parameters that maximize the returns, but applying the same technique to maximize the Sharpe Ratio instead is a simple extension.
Does optimizing the parameters of a strategy guarantee its future profitability?
Optimizing the parameters of a trading strategy based on past data does by no means guarantee future profitability.
If we optimize the parameters using the same data we use for the backtest, it will be impossible to determine whether the strategy was able to capture a signal in the data or just captured the noise. It’s worth remembering that asset prices have an extremely low signal-to-noise ratio. As a consequence, the optimal parameters will most likely be overfitted.
Check out my article on overfitting.
How to check if a strategy is robust?
The following two main complementary approaches allow quants to test whether a strategy is reliable or not (in probabilistic terms).
Out-of-sample testing
This practice consists of splitting a time series into two (sometimes three) smaller and non-overlapping ones. One is used for optimizing the trading strategy parameters, and the other is used to check if a similar performance can be achieved on data that has never been used. A hypothetical example of out-of-sample testing looks as follows:

An extension of this approach is called walk-forward optimization. You can read all about it in this article I wrote. It could be intuitively represented as follows:

Test for parameter stability
A model is considered more robust if marginal (subtle) parameter changes don’t drastically change the strategy’s performance.
Consider the following region from the table we created previously:
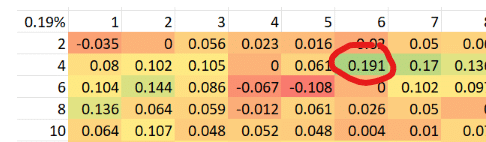
We could be tempted to implement our MACD strategy with the lookback periods set to 4 and 6, respectively. This would be a poor choice since most nearby parameter combinations yield very poor results.
On the other hand, the following region has, at least upon visual inspection, more stable parameters:

It goes without saying that I still would not trust those parameters since they are most likely just a glorified consequence of overfitting. Out-of-sample testing is not only a sound approach but a required one!
No responses yet