
Every once in a while, we come up with a trading strategy whose backtest seems too good to be true. In most cases, we randomly found a set of indicators that generated a set of profitable signals in the past but had no predictive power. In other words, these promising results won’t extrapolate into the future.
Consequently, a single backtest is insufficient to move forward and live trade the strategy, and it is necessary to perform subsequent tests.
Walk-Forward Optimization is an often ignored method that every rigorous trader should do before trading a strategy. In this article, I’ll cover the most relevant aspects of this technique so that you can get started on the right foot.
If you want to learn how to implement this technique in Python, check out this tutorial I wrote!
Table of Contents
What Is Walk-Forward Optimization?
Walk-forward optimization is the process of testing a trading strategy by finding its optimal parameters during a specific period, referred to as the “in-sample” dataset, and checking the performance of those parameters in the following period, which is called the “out-of-sample” dataset.
Subsequently, both the in and out of sample datasets are moved forward, and the analysis is repeated with a new set of price data. Once we complete all iterations, the recorded results are analyzed to assess whether the strategy is profitable.
In short:
- In-Sample Data or training data is a past segment of market data reserved for testing purposes. This data is for selecting the set of parameters that maximizes our objective metric, which is usually risk-adjusted.
- Out-of-Sample Data or testing data is the reserved data set that is not a part of the in-sample data.
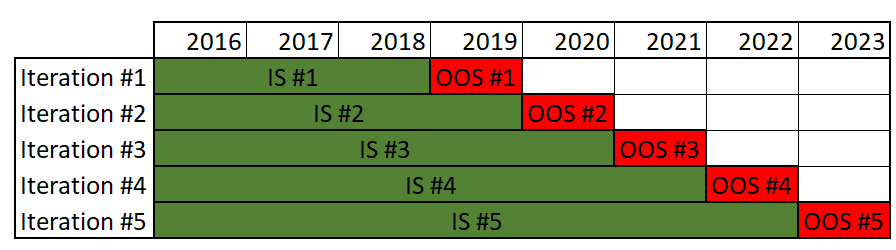
The figure above presents an unanchored walk-forward optimization chart with 6-year in-sample periods and 1-year out-of-sample periods.
Walk-forward optimization is more complex than simple backtesting. Because of that, you should demand a good argument for using it. In the next section, I’ll try to convince you to adopt it as part of your research pipeline.
Why Should We Use Walk-Forward Optimization?
Backtesting a strategy gives a good understanding of what happened on the market in the past, but it can’t tell the future. Fortunately, walk-forward optimization does tell the future (to some extent). Any trader who used backtesting and saw the performance of their strategies on live data understands that historical performance is not always an indicator of future realizations.
A great backtest won’t keep the strategy standing when confronted with new market data. We call this “curve fitting” or “overfitting,” which means that the strategy is fitted to random market noise rather than actual market behavior. And since the strategy was based on randomness, it is also expected for future results to be so.
To avoid this, we must test our trading strategy before applying it. Walk-forward optimization yields valuable information regarding the robustness of a trading strategy and permits testing of how a strategy adapts to current market conditions by allowing the retraining of a model or recalibrating the parameters of the indicators used.
A walk-forward optimization forces us to verify that we are adjusting our strategy parameters to signals in the past by constantly testing our optimized parameters with out-of-sample data. It helps us produce strategies that don’t fall apart in live trading, aiming to separate the randomness of the market from the actual edge. This is a concept that’s called out-of-sample testing.
Out-of-sample testing refers to the process of splitting the data and saving one part to use as validation once the strategy is ready. As such, the testing is carried out only on a portion of the data and not on its entirety. The portion of the data used for initial testing is called in-sample data or testing data; the other, used for validation, is called out-of-sample or testing data.
The rationale behind out-of-sample testing is that random patterns won’t persist through both data sets because any strategy that was curve fit should fall apart once we test on the new random data. Walk-forward optimization allows our strategy to adapt to prevailing market conditions through periodic optimizations. In the example below, these optimizations occur yearly. Having multiple optimizations also gives a glimpse into the strategy’s parameter stability.
How to Do Walk-Forward Optimization Process
Step 1: Get All the Relevant Data
The most basic data needed is the price of the financial product we are trading. For example, if we run a strategy involving companies A and B, we need the prices of A and B stocks over a certain period. Typically, the strategy will also require additional data, like the S&P Index price, the number of positive reviews that these companies get, or anything relevant to the evolution of their stock price. This data is often referred to as alternative data, and you can find more about it in this article I wrote on the topic.
Step 2: Break Data Into Multiple Windows
Let’s say that we break our data up into 10 windows; our first window of data is our first in-sample data. We’ll use this data in the next step to optimize our strategy.
Step 3: Run an Optimization to Find the Best Parameters on the First Window of the Data
In this step, we will run an optimization on that first in-sample data to find the parameter values that yielded the best result for that given period.
For example, let’s assume that our strategy consists of buying “Asset A” and shorting “Asset B“, if the overall sentiment based on Reddit comments for Asset A is higher than for Asset B. By doing so, a strategy parameter could be the number of recent positive reviews for the company A divided by the number of recent positive reviews for the company B (we get the PRA/PRB strategy parameter). We are trying to determine what values of PRA/PRB should trigger the corresponding buy and sell orders.
Let’s assume that based on the optimization, we establish to buy A and short B when PRA/PRB is 2 or higher. Conversely, when PRA/PRB is 0.5 or lower, we short A and buy B. These parameters are optimized only by looking at the first in-sample dataset.
Note that this is an oversimplified strategy. To make it simple, we used only one strategy parameter. However, most strategies usually require more parameters and further fine-tuning.
Remember that having many strategy parameters does not necessarily improve the strategy. In fact, this often increases the probability of ending up with an overfitted model.
Step 4: Apply Those Parameters to the Second Window of the Data
Our second window of data is the first out-of-sample data. Following our example, we should apply the optimized parameter values of 2 and 0.5 to this second data window and calculate our strategy’s performance.
We are interested in this performance, as it tells us if the data in the in-sample period has any predictive value in the proceeding out-of-sample period.
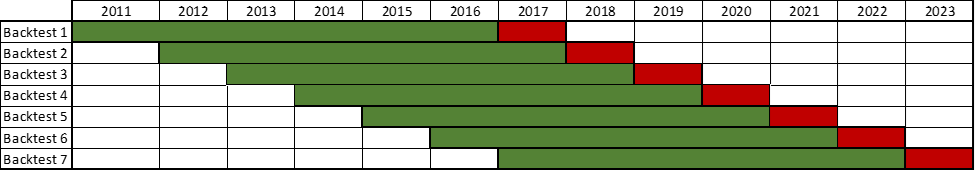
Step 5: Iterate until all the data is used
We repeat steps 3 and 4 until we reach our last window of out-of-sample data. By the end of this hypothetical example, we will have performed 5 out-of-sample tests, which will allow us to understand the strategy much better than if we only performed a single backtest.
We should also combine the performances of all the out-of-sample tests. This is the final performance of our strategy.
How to Define the Parameters of a Walk-Forward Optimization
Before we start a WFO, we need to choose its basic parameters:
- The number of runs
- The out-of-sample percentage (OOS%).
Through WFO, we can lengthen the period of our out-of-sample test without sacrificing in-sample data used for parameter optimization. The traditional approach for an out-of-sample test is to allocate a portion of our data for in-sample calibration, leaving the remainder untouched for out-of-sample testing.
More in-sample data is desirable because it trains the strategy to adapt to different market conditions. Yet, we want to maximize the amount of data available for out-of-sample robust testing.
A single train-test split would look as follows:
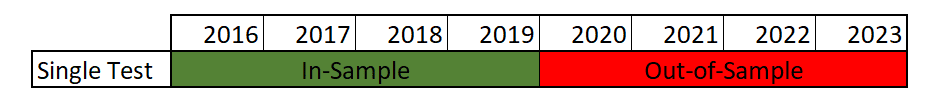
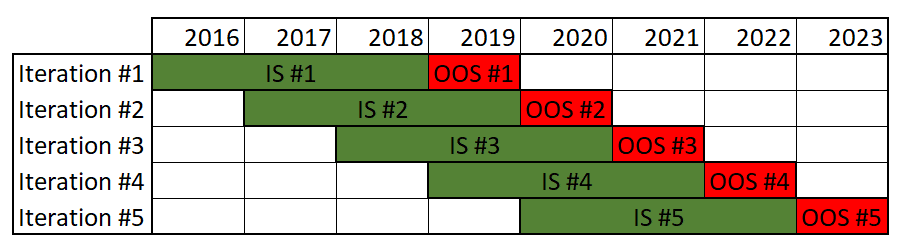
In the above example, we split the 8 years of data evenly, resulting in a 4-year out-of-sample backtest. By using walk-forward optimization, we can perform this test multiple times, like in the following example:
Here, the ratio of in-sample data to out-of-sample data is 3 to 1 for each run, resulting in a 5-year out-of-sample backtest. Therefore, by cleverly manipulating the available data, WFO lengthens both the in-sample training period and the out-of-sample robustness testing period.
As you can also see, WFO allows us to backtest the strategy with periodic model retraining, which is much closer to how the strategy would be deployed.
Number of Runs
This is the number of times each in-sample optimization, and out-of-sample testing cycle is done. There are 5 runs in our last example.
Defining the number of iterations to be performed is somewhat arbitrary and depends on each specific case. It is desirable to have a large enough number of trades on each iteration. This allows us to compare the results and estimate how (un)stable our strategy is. As a rule, try to have at least 200 trades in each iteration. This number should be higher or lower depending on how similar the P&L of the trades is.
Size of In-Sample and Out-Of-Sample Data
Out-of-sample percentage (OOS%) is the OOS data length compared to the IS data length. In our previous example, we had a 33% OOS because IS = 3 years and OOS = 1 year.
Our in-sample data should be large enough to predict specific behavior in the out-of-sample period. If our in-sample data is too large, the in-sample calibration will result in less reliable signals.
The machine learning community has the convention of doing an 80%-20% split of the data. This is not always possible when backtesting a trading strategy, and the split depends on the specifics of the model. If our model has interannual indicators, both our in and out of sample datasets need at least one year of data each.
Additionally, as we previously mentioned, our out-of-sample dataset should generate a large enough tradelog to allow us to analyze it statistically.
Considerations
As
These two settings, although seemingly trivial, play a significant role in determining the outcome. Increasing the OOS% has both its advantages and disadvantages:
- The more runs we make and the larger the OOS%, the longer the OOS test will be. With a larger number of iterations, we can have increased confidence that our model is capturing some signal in the data and not just replicating the in-sample noise. This also means more frequent recalibrations are required, which can be a hassle if an extensive portfolio is managed.
- The OOS% should not be too large. Otherwise, it will likely have too few trades in the optimization period for a reliable estimate of the optimal strategy parameters.
As a rule of thumb, it is recommended to set these meta-parameters as follows:
- # Of Iterations: between 10 and 30
- Out-of-Sample Percentage: between 10% and 40%
The chosen WFO strategy should be aligned with the strategy’s objectives. For example, if we are developing a strategy on a daily timeframe (intraday trading), it makes no sense to reoptimize only once per year.
Inexperienced traders tend to spend a lot of time optimizing every parameter on the entire set of past data, and then they proceed to trade using these over-optimized parameters. This will, most likely, be the receipt of a losing strategy.
Anchored vs. Unanchored Walk-Forward Optimization
Our example uses unanchored WFO, also called rolling WFO, whereby the start date of each subsequent in-sample period is moved forward by an amount equal to the length of each out-of-sample period. Unanchored WFO allows the parameters to adapt faster to current conditions, and it is more suitable for short-term strategies or if the market has a changing behavior.
Above, we can see an anchored WFO, whereby the dataset of each in-sample period gets longer as we progress through the iterations. Anchored means that the starting point of all periods is the same as the starting point of the first. It has the advantage of incorporating more data for calibration, but the model will adapt slower on each subsequent iteration. This is most probably not how we would recalibrate the model in real life, which makes our backtest less reliable.
Choosing an Appropriate Objective Function
An objective function is the variable or combination of variables we want to maximize or minimize in our optimizations. For instance, if our objective function is overall profit, we find the parameters that maximize the overall strategy profit during the in-sample period.
We usually want an objective function that has an element of both reward and risk, referred to as a risk-adjusted metric. Making $100 while risking $200 is worse than making $50 while risking $15. Without using a proper risk-adjusted metric, the system will choose the least favorable case in our previous example: the $100 possible profit that puts $200 at risk.
Some examples of these risk-adjusted objective functions are:
- Sharpe Ratio
- Total Returns over Maximum Drawdowns
- Total Returns over Average Drawdowns.
Analyzing Walk-Forward Optimization Results
WFO tells us if a strategy is robust enough and whether its performance can be improved by reoptimizing.
For analyzing it, we can use the WFO performance metrics that refer to how well the out-of-sample metrics compare to the in-sample metrics. Some of the most used WFO metrics are presented below.
Walk-Forward Efficiency
WFE Is the ratio of the annualized OOS profit over the annualized IS profit. Some performance deterioration is expected when applying the strategy to OOS data. An efficiency of 100% shows us that OOS results are as good as the IS results. A minimum efficiency of 50% is often used as a passing criterion.
Percentage of Profitable Runs
This measures the consistency of the profits. It is a desirable property of any strategy to be consistent over time.
Distribution of Profits
Ideally, we should aim for an even profit distribution, meaning that each run contributes roughly the same amount to the overall profits. If any given run has an abnormally large contribution, it could be due to an unlikely event (a price shock). We should be somewhat skeptical if a single OOS window accounts for most of the profits of the entire period.
Does Walk-Forward Optimization Solve Overfitting?
If correctly implemented, walk-forward optimization is one of the best ways to avoid overfitting a trading strategy.
Despite that, I’ve seen countless examples of WFO being itself iterated until a supposedly profitable strategy is found. This approach will not only not detect overfitting, but in fact, lead to it.
A signal is any useful fundamental information we could aim to capture, whereas noises are distractions that don’t provide any real value. Overfitting is when a trading system adapts too much to the noise in historical data and is, therefore, utterly ineffective on new data. Performing lots of optimizations by adding and removing indicators will, again, result in overfitting.
Suppose we do walk-forward optimizations with different models and indicators until we arrive at a model that passes our requirements. In that case, we will eventually find a supposedly profitable model that will most likely be an overfitted strategy.
4 Responses
hi Martin,
this is a very good article. congrats.
I am looking for an automated solution for metatrader5.
can you advise me any?
Hi Serkan, I’ve never used Metatrader5. I’ve done a quick search, and it looks like this can be achieved using mt5, but I’m unable to recommend an approach. Sorry for not being more helpful!
This is clear and really well written. I can’t help but wonder though does WFA over stress test a strategy. Is there not a risk that it can write off some otherwise profitable strategies? Is out of sample testing + incubation not enough? Genuinely curious.
You raise an excellent point, Peter. As you suggest, when it comes to statistics (trading), there are two types of errors: keeping a hypothesis (strategy) that is actually false, and discarting a hypothesis (strategy) that is actually true. Performing more tests will increase the risk of the latter.
I think it comes down to personal preferences. In my case, I prefer to be as strict as possible. It would be nice to know the probability of coming up with a good strategy and measure if you are keeping/discarting below or above that percentage. Given the fact that most strategies do not work, it makes sense to also discard most of them (assuming that our filtering process works properly).