

Yahoo Finance is definitely one of the most popular sources of stock market data available for retail traders, and is as such the first data source that most of us used back when we got started. It is also worth mentioning that its ease of use and array of datasets allow for quick prototyping, making it a valuable source for backtesting research ideas and implementing very basic strategies.
Although there are more than a few Python libraries that enable coders to have programmatic access to the unofficial API of Yahoo Finance, yfinance stands out as one of the oldest, most reliable, and actively used libraries out there.
In this article, I’ll cover the most useful aspects of this library, and I’ll even go into some detail describing its parameters.
Before getting started, it’s worth mentioning that I recommend using BacktestXL if you’re not a proficient Python programmer. BacktestXL is a backtesting engine that works natively in Microsoft Excel, and its free plan allows users to fetch historical stock prices without a single line of code. Disclaimer: we’re the developers, but it really is the software we use for our personal research!
Table of Contents
Installing yfinance
Installing yfinance is a straightforward process, but Python and PIP have to be installed beforehand. If you do not already have them installed, watch the following video.
You’ll notice that the tutorial installs “Anaconda” which is a Python distribution that comes with all the most important bells and whistles included, and PIP is among them.
Assuming that you followed the previous steps, the remainder of the installation is trivial. You just need to open a terminal and write the following command:
pip install yfinanceNow you should be able to follow along during the next sections!
Fetch Historical Prices using yfinance
One of the most critical use cases of yfinance is the possibility to access stocks (and some cryptocurrencies’) historical data. These include OHLCV (Open, High, Low, Close, Volume) bars, and also dividend payments, and stock splits.
In order to get started, we have to create a Ticker instance and pass the symbol of the asset that we are interested in getting data.
# IMPORT THE LIBRARY
import yfinance as yf
from datetime import datetime
# CREATE TICKER INSTANCE FOR AMAZON
amzn = yf.Ticker("AMZN")
# GET TODAYS DATE AND CONVERT IT TO A STRING WITH YYYY-MM-DD FORMAT (YFINANCE EXPECTS THAT FORMAT)
end_date = datetime.now().strftime('%Y-%m-%d')
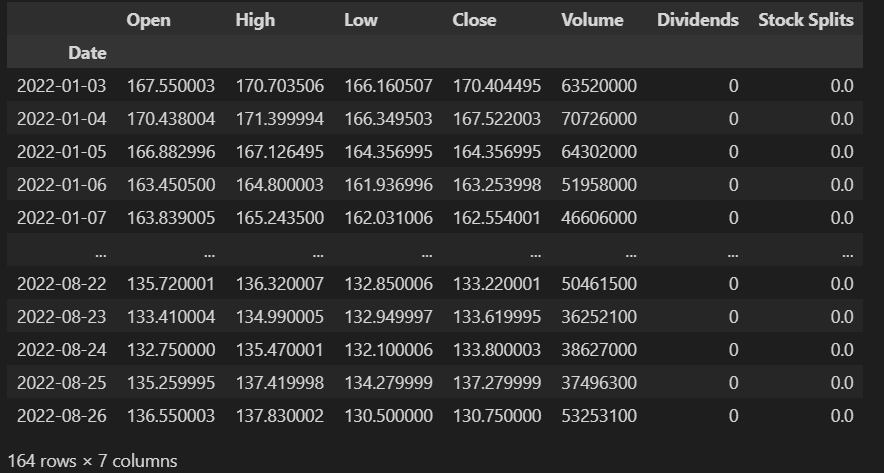
amzn_hist = amzn.history(start='2022-01-01',end=end_date)
print(amzn_hist)Running the script will result in the following pandas DataFrame:
By default, yahoo returns daily data, but we can also parametrize the bar size. It is worth mentioning that different bar sizes have different limitations regarding how far back we can go in time.
The following bar sizes are available:
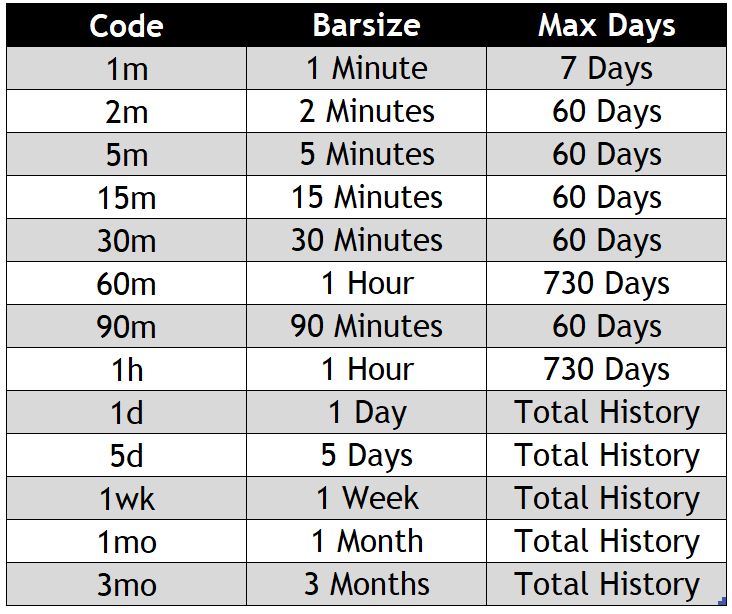
Requesting an interval (start – end) greater than the limitations will result in an error. You can avoid this error by only asking for the maximum allowed days of data. This is done by setting the parameter “period” to ‘max’, in addition to either “end” or “start” (but not both)
The following examples fetch the most recent dataset of 1-minute data for AMZN.
# GETTING THE MAX AMOUNT OF RECENT 1 MINUTE DATA.
# OBSERVATION: THE VARIABLE 'end_date' WAS DECLARED IN THE PREVIOUS CODE SNIPPED
amzn_hist = amzn.history(period='max',end=end_date,interval='1m')
It is also possible to retrieve historical data of more assets with a single request. This can be done by instantiating a Tickers object (plural instead of singular).
companies = ['AMZN','GOOG','WMT','TSLA','META']
tickers = yf.Tickers(companies)
tickers_hist = tickers.history(period='max',end=end_date,interval='1m',)
tickers_hist
Running said script will result in the following pandas DataFrame:
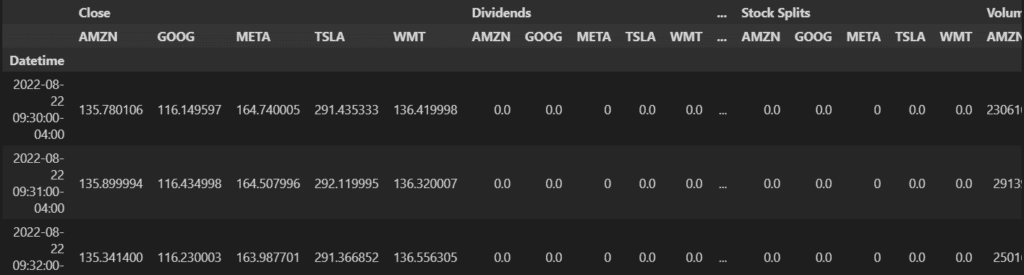
You might notice that the returned dataframe has a MultiLevel Index, which is an undesired structure for most purposes.
We can transform the structure in a more convenient way by using the code below:
# TRANSFORM MULTI-LEVEL INDEX INTO A SINGLE-INDEX SET OF COLUMNS.
tickers_hist.stack(level=1).rename_axis(['Date', 'Ticker']).reset_index(level=1)
This will transform the previous DataFrameinto the following more convenient structure:
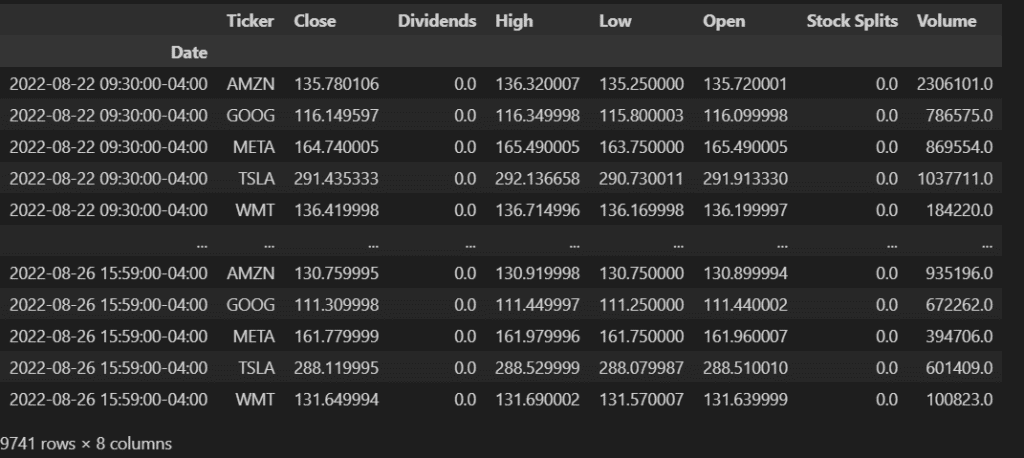
As can be seen, this resulted in a DataFrame with a single row for each symbol and minute of data available. Except for the additional “Ticker” column, the remaining columns preserves the same structure as the single asset case.
Last but not least, it is sometimes convenient to store the retrieved data locally instead of requesting it multiple times from Yahoo. This is not only due to request limits imposed by the server but also to loading/requesting times (it is much faster to load the data stored locally).
# THIS CODE SNIPPET SAVES THE ENTIRE DATAFRAME IN A CSV FILE
tickers_hist.to_csv('all_data.csv')
The “history” function includes lots of parameters, and knowing them is important in order to correctly interpret the data you’re receiving:
- period: As seen before, especially useful is the value “max”. The following are the valid values: 1d,5d,1mo,3mo,6mo,1y,2y,5y,10y,ytd,max.
- interval: Defines the size of each bar. Smaller bar sizes have more strict limitations, and only 7 days of 1-minute data can be retrieved. The following are the valid values: 1m,2m,5m,15m,30m,60m,90m,1h,1d,5d,1wk,1mo,3mo
- start: Start date. The server expects a string formatted as YYYY-MM-DD.
- end: End date. The server expects a string formatted as YYYY-MM-DD.
- repost: Defines whether to include or not data not corresponding to regular trading hours. The default value is False
- auto_adjust: whether to adjust prices to stock splits and dividend payments. The default value is True.
Fetch fundamental data using yfinance
Yahoo Finance also allows fetching a multitude of financial information, such as balance sheet data, historical events, and commonly used ratios. The same ticker object used before can fetch the following information:
- get_actions: returns the dates of dividend payouts and stock splits
- get_analysis: returns projections and forecasts of relevant financial variables, such as growth, earnings estimates, revenue estimates, EPS trends, etc. It returns the data available on yahoo finance under the “Analysis” tab (example)
- get_balance_sheet: returns historical yearly balance sheet data of a given company. It is analogous to the information available on Yahoo Finance under the “Balance Sheet” section of the “Financials” tab (example)
- get_calendar: returns important future dates and the datatype that is going to be disclosed on said date, in addition to their current estimates (low, average, and high).
- get_cashflow: returns the historical yearly cash flows of a given company. Analogous to the “Cash Flow” section under the “Financials” tab in Yahoo Finance (example)
- get_info: returns a dictionary with relevant information regarding a given company’s profile. Zip Code, industry sector, employee count, summary, city, phone, state, country, website, address, etc.
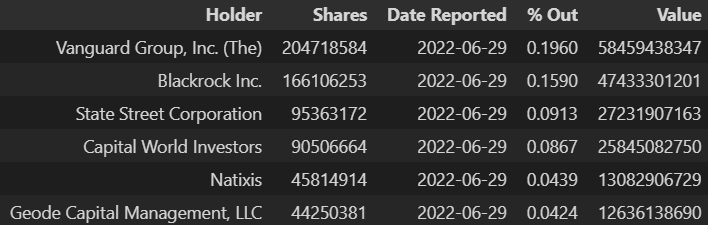
- get_institutional_holders: returns the list of relevant institutional holders (such as Vanguard, BlackRock, etc.). It consists of a dataframe with the institution’s name, the number of shares it holds, the date said information was reported, the percentage it represents in relation to total shares outstanding, and the total value of the holdings.
- get_news: returns a list of relevant news, as posted on Yahoo Finance.
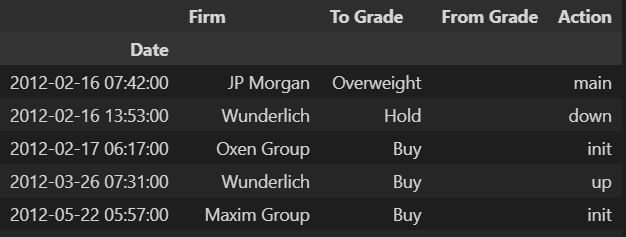
- get_recommendations: returns a dataframe with the current recommendations of a list of relevant rating agencies and firms (such as JP Morgan, Wunderlich, Maxim Group, etc).
- get_sustainability: returns a dataframe of information regarding some relevant metrics for investors with ESG objectives or moral/ethical requirements. Some features are scores (ESG metrics), whereas others are classifications (gambling, alcohol, weapons)
What follows is a working code snippet of all the functions described above!
import yfinance as yf

# CREATE A TICKER INSTANCE PASSING TESLA AS THE TARGET COMPANY
tsla = yf.Ticker('TSLA')

# CALL THE MULTIPLE FUNCTIONS AVAILABLE AND STORE THEM IN VARIABLES.
actions = tsla.get_actions()
analysis = tsla.get_analysis()
balance = tsla.get_balance_sheet()
calendar = tsla.get_calendar()
cf = tsla.get_cashflow()
info = tsla.get_info()
inst_holders = tsla.get_institutional_holders()
news = tsla.get_news()
recommendations = tsla.get_recommendations()
sustainability = tsla.get_sustainability()

# PRINT THE RESULTS
print(actions)
print('*'*20)
print(analysis)
print('*'*20)
print(balance)
print('*'*20)
print(calendar)
print('*'*20)
print(cf)
print('*'*20)
print(info)
print('*'*20)
print(inst_holders)
print('*'*20)
print(news)
print('*'*20)
print(recommendations)
print('*'*20)
print(sustainability)
print('*'*20)
Fetch Options Chain Data from Yahoo Finance
You might also be surprised by the fact that yahoo finance contains options chain data (options chain is the list of all options contracts available for a given asset). Its use is not only simple and straightforward but also rich in terms of the data retrieved.
The following script is a working example of how to retrieve all the put and call options for Tesla.
# IMPORT REQUIRED LIBRARY
import yfinance as yf
# CREATE A TICKER INSTANCE FOR TESLA
tsla = yf.Ticker('TSLA')
# FETCH OPTIONS CHAIN DATA FOR THE COMPANY
tsla_options = tsla.option_chain()
# ACCESS BOTH THE CALLS AND PUTS AND STORE THEM IN THEIR RESPECTIVE VARIABLES
tsla_puts = tsla_options.puts
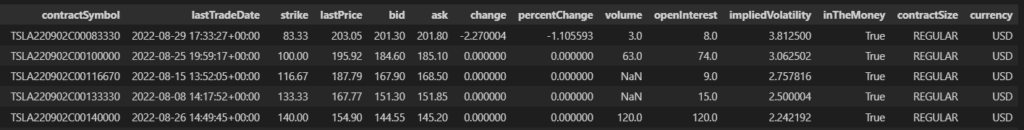
tsla_calls = tsla_options.callsAs an example, this is an excerpt of the DataFrame containing the Call Options for Tesla as of writing this article:
Pros and Cons of yfinance
Pros of yfinance
- Free of charge: the fact that the access to the vast amount of data offered by Yahoo Finance is free of charge is definitively its biggest advantage.
- Lots of datasets: in contrast to other data sources, Yahoo Finance offers a wide array of datasets, from intraday price data to ESG scores.
- Actively maintained: although it might not sound relevant, the fact that the yfinance library has a large community of users adds an extra layer of robustness and reliability to the library. This reliability is limited because of the unofficial nature of the library.
Disadvantages
- Unofficial library: the library is developed by a community of users and not by the data provider itself. Yahoo Finance can update its API at any given time without giving prior notice to the developers, leading to short periods of time where the data is inaccessible or corrupt.
- Unreliable: because it is an unofficial library, both the quality of the data and the access to it is not guaranteed by the vendor. Yfinance should never be used for live trading with real money.
Tips and tricks using yfinance
Plotting a Candlestick Chart using yfinance and finplot
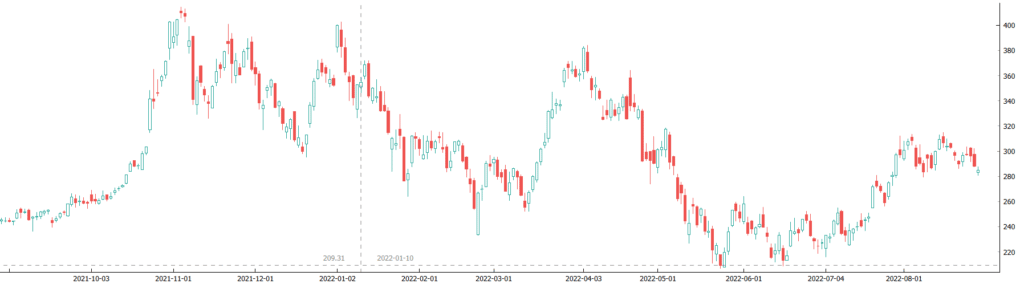
A common task of price data is plotting it using candlesticks, which is very straightforward if we use yfinance in addition to Finplot. The following snippet is a working example that retrieved the chart above.
# IMPORT REQUIRED LIBRARIES
# YOU SHOULD MAKE SURE THAT YOU ALREADY INSTLALED THEM PREVIOUSLY
import yfinance as yf
import finplot as fplt

# CREATE A TICKER INSTANCE FOR TESLA
tsla = yf.Ticker('TSLA')

# RETRIEVE 1 YEAR WORTH OF DAILY DATA OF TESLA
df = tsla.history(interval='1d',period='1y')

# PLOT THE OHLC CANDLE CHART
fplt.candlestick_ochl(df[['Open','Close','High','Low']])
fplt.show()
Change OHLC bar size with yfinance and pandas
Another common issue arises when we need to change the bar size of the data retrieved by Yahoo. We might be interested in creating bar data with a custom size that is commonly not used, such as 45 minutes. In order to do so, we have to group smaller size bars into 45-minute candles. We could use 1, 5, or 15-minute bars, 15 being the most convenient value since it allows us to fetch more data.
The following script fetches 60 days’ worth of 15-minute bar data of Tesla:
import yfinance as yf
import finplot as fplt

tsla = yf.Ticker('TSLA')
df = tsla.history(interval='15m',period='60d')
print(df)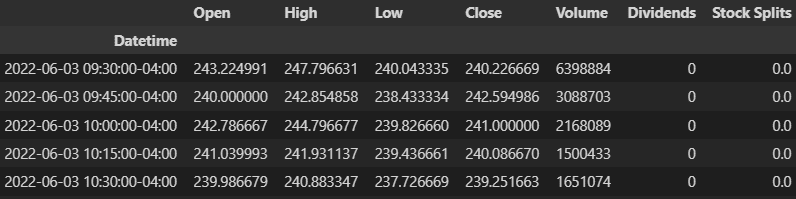
And the following script transforms said data into 45-minute bars:
import pandas as pd
df_45min = df.groupby(pd.Grouper(freq='45Min')).agg({"Open": "first",
                                             "High": "max",
                                             "Low": "min",
                                             "Close": "min",
                                             "Volume": "sum"})
By using the pandas groupby function, we can aggregate data according to our specific needs. OHLC requires different groupings since the Open is the first price of every period, High is its maximum price, Low is its minimum price, Close is the last price, and Volume requires adding all values of the column. The result of that function looks as follows:
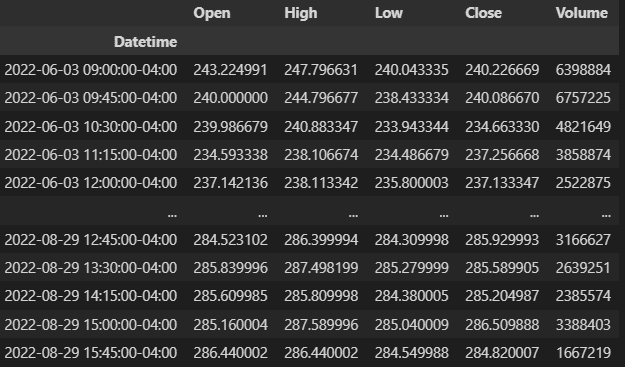
Notice that in regrouping the DataFrame, we got rid of the Data Splits and Dividends columns.
Frequently Asked Questions (F.A.Q)
Is yfinance the official library for Yahoo Finance?
The yfinance library is not officially maintained nor developed by Yahoo but by a community of users. Although Yahoo Finance allows users to have access to their finance API, it does so in an informal way. Users do not require to subscribe, pay a fee, or even generate an API Key. As a consequence, Yahoo does not provide any type of support nor notify users about changes in the API endpoints. As a consequence, the yfinance library was developed and maintained by a handful of developers not related to Yahoo
Is Yahoo Finance reliable?
YahooFinance and the yfinance library are both excellent sources of information for research and prototyping purposes. The fact that it offers a wide array of valuable information for free is definitively its biggest advantage.
Having said that, the source only is useful as a reference and should never be used for real-life trading purposes. The data does not hold up to regular quality standards in the industry. For example, their options chain data is oftentimes incomplete to say the least.
Additionally, Yahoo Finance allows the use of their API, but only in an informal fashion. Last but not least, the yfinance library is not actively maintained by Yahoo but by a generous community of users. As a consequence, the library might not work from time to time since Yahoo regularly updates their API, and the community fixes the library reactively instead of preemptively.
Is yfinance data free?
All data points retrieved by the yfinance library are completely free of charge. Having said that, not all data endpoints offered by Yahoo Data are accessible by yfinance functions. Some features require a paid subscription from Yahoo Finance.
Is there an alternative to Yahoo Finance?
Being an unofficial library, it is not uncommon for yfinance to suddenly stop working. Thus, having another free alternative is essential.
Although less popular, YahooQuery is another open-source Python library that fetches data from Yahoo Finance. You can install it simply by typing “pip install yahooquery” on your terminal. The library is also actively maintained and decently documented (Github / Documentation).
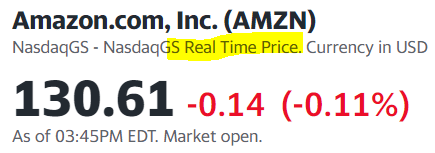
Is yfinance (Yahoo Finance) data live
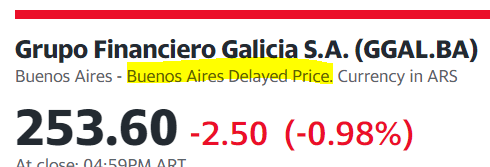
Most quotes are live, although this depends mostly on the market in which a given company is listed. All US-based exchange quotes are live on Yahoo Finance (and on yfinance).
You should check other markets individually since they might have a 15 minutes inbuild delay. Just as a random example, Argentinean stocks have said delay.
Troubleshooting
Error: “yfinance failed to decrypt yahoo data response”
As of now, this is an open issue. This error might arise when trying to get the info of a ticker or the fundamentals. The developers have solved the issue for the former case but not for the latter. As a consequence, the solutions depend on which data you’re trying to fetch
- Company Information: to solve this issue, you should update yfinance (“pip install –upgrade yfinance“).
- Company fundamentals: the issue is still unresolved. In the meantime, you can use YahooQuery, an alternative and less popular Python package with similar capabilities.
13 Responses
Awesome, thanks for sharing
I’m glad you found it useful! Thanks for the feedback!
Thanks for sharing! But how I can get daily changes (%)?
You can add the inter-period pct change using pandas. Assuming that you already have the OHLCV data from yfinance, you can create a new column as follows:
df[‘pct_change’] = df[‘Close’].pct_change()
I hope I could help!
I have installed yfinance through pip, but when I paste your “snippet” code to get all the functions listed, it doesn’t work.
raise Exception(“yfinance failed to decrypt Yahoo data response”)
Exception: yfinance failed to decrypt Yahoo data response
I had the same error a few weeks ago and solved it by updating the library (pip install –upgrade yfinance). I hope that solves your issue!
Thanks Martin for such a wonderful read
I’m glad you liked it! Thanks for the feedback!
do you know if there is a way to pull info such for a future contract such as tick size, margin required, multiplier, etc?
I wonder how to understand the Open/Close for 1h period of data. For example, for 9:30 in the morning, I found the Open price of 9:30 a.m. is the same as the Open price of the same day, and the market opens at 9:00 a.m. it is reasonable. So should I assume that Close price of 9:30 a.m. is the price of 10:00 a.m. ? Which means the entry marked with 9:30 a.m. is about the hour from 9:00 to 10:00 a.m.?
Hi Lisa! Regular trading hours are from 9:30 to 4:00, so it makes sense for the first 1hour bar to have the same open as the daily bar.
thanks for the guide Marty. Is it possible to get income statement and balance sheet information ?
just a little correction:
“Close”: “last”, not : “Close”: “min”
Otherwise “Close” == “Low”
thks for the post